Canvas in the terminal with canvas-tui
Intro⌗
What better way to spend time during quarantine than to program an application nobody will ever use? Well obviously I couldn’t come up with anything, so I did just that.
canvas-tui is an application I wrote in order to view my grades, assignments, and other school information from the comfort of my terminal.
This is one of those occasions I have mentioned in previous articles, where no premade solution was readily available, so I was forced to give it a shot myself. The fact that I was able to produce a perfectly functional application in less than a week is a testament to the flexibility and efficacy of a linux terminal based workflow.
History⌗
About two weeks before I developed canvas-tui, me and a friend teamed up on a small, python based utility called canvas-cli. This program can take simple command line arguments and output tables containing your grades, assignments, and more.
Here, I used a great program called wtfutil to throw together a static dashboard that showed the result of running various canvas-cli commands.
Other than that, I still use it to quickly download a desired file from my course into the working directory.
canvas-tui⌗
My original plan was to use canvas-cli and plug its output into a terminal interface. I decided on go as my language for this project, as I wanted to take advantage of the
termui library.
Before this project, I had not written a single line of go in my life. I looked into piping output from python into go, but it seemed like far more trouble than it was worth in the end.
I decided on rewriting most all of canvas-clis features in go, which makes it much easier to integrate new features not possible in canvas-cli.
Dashboard⌗
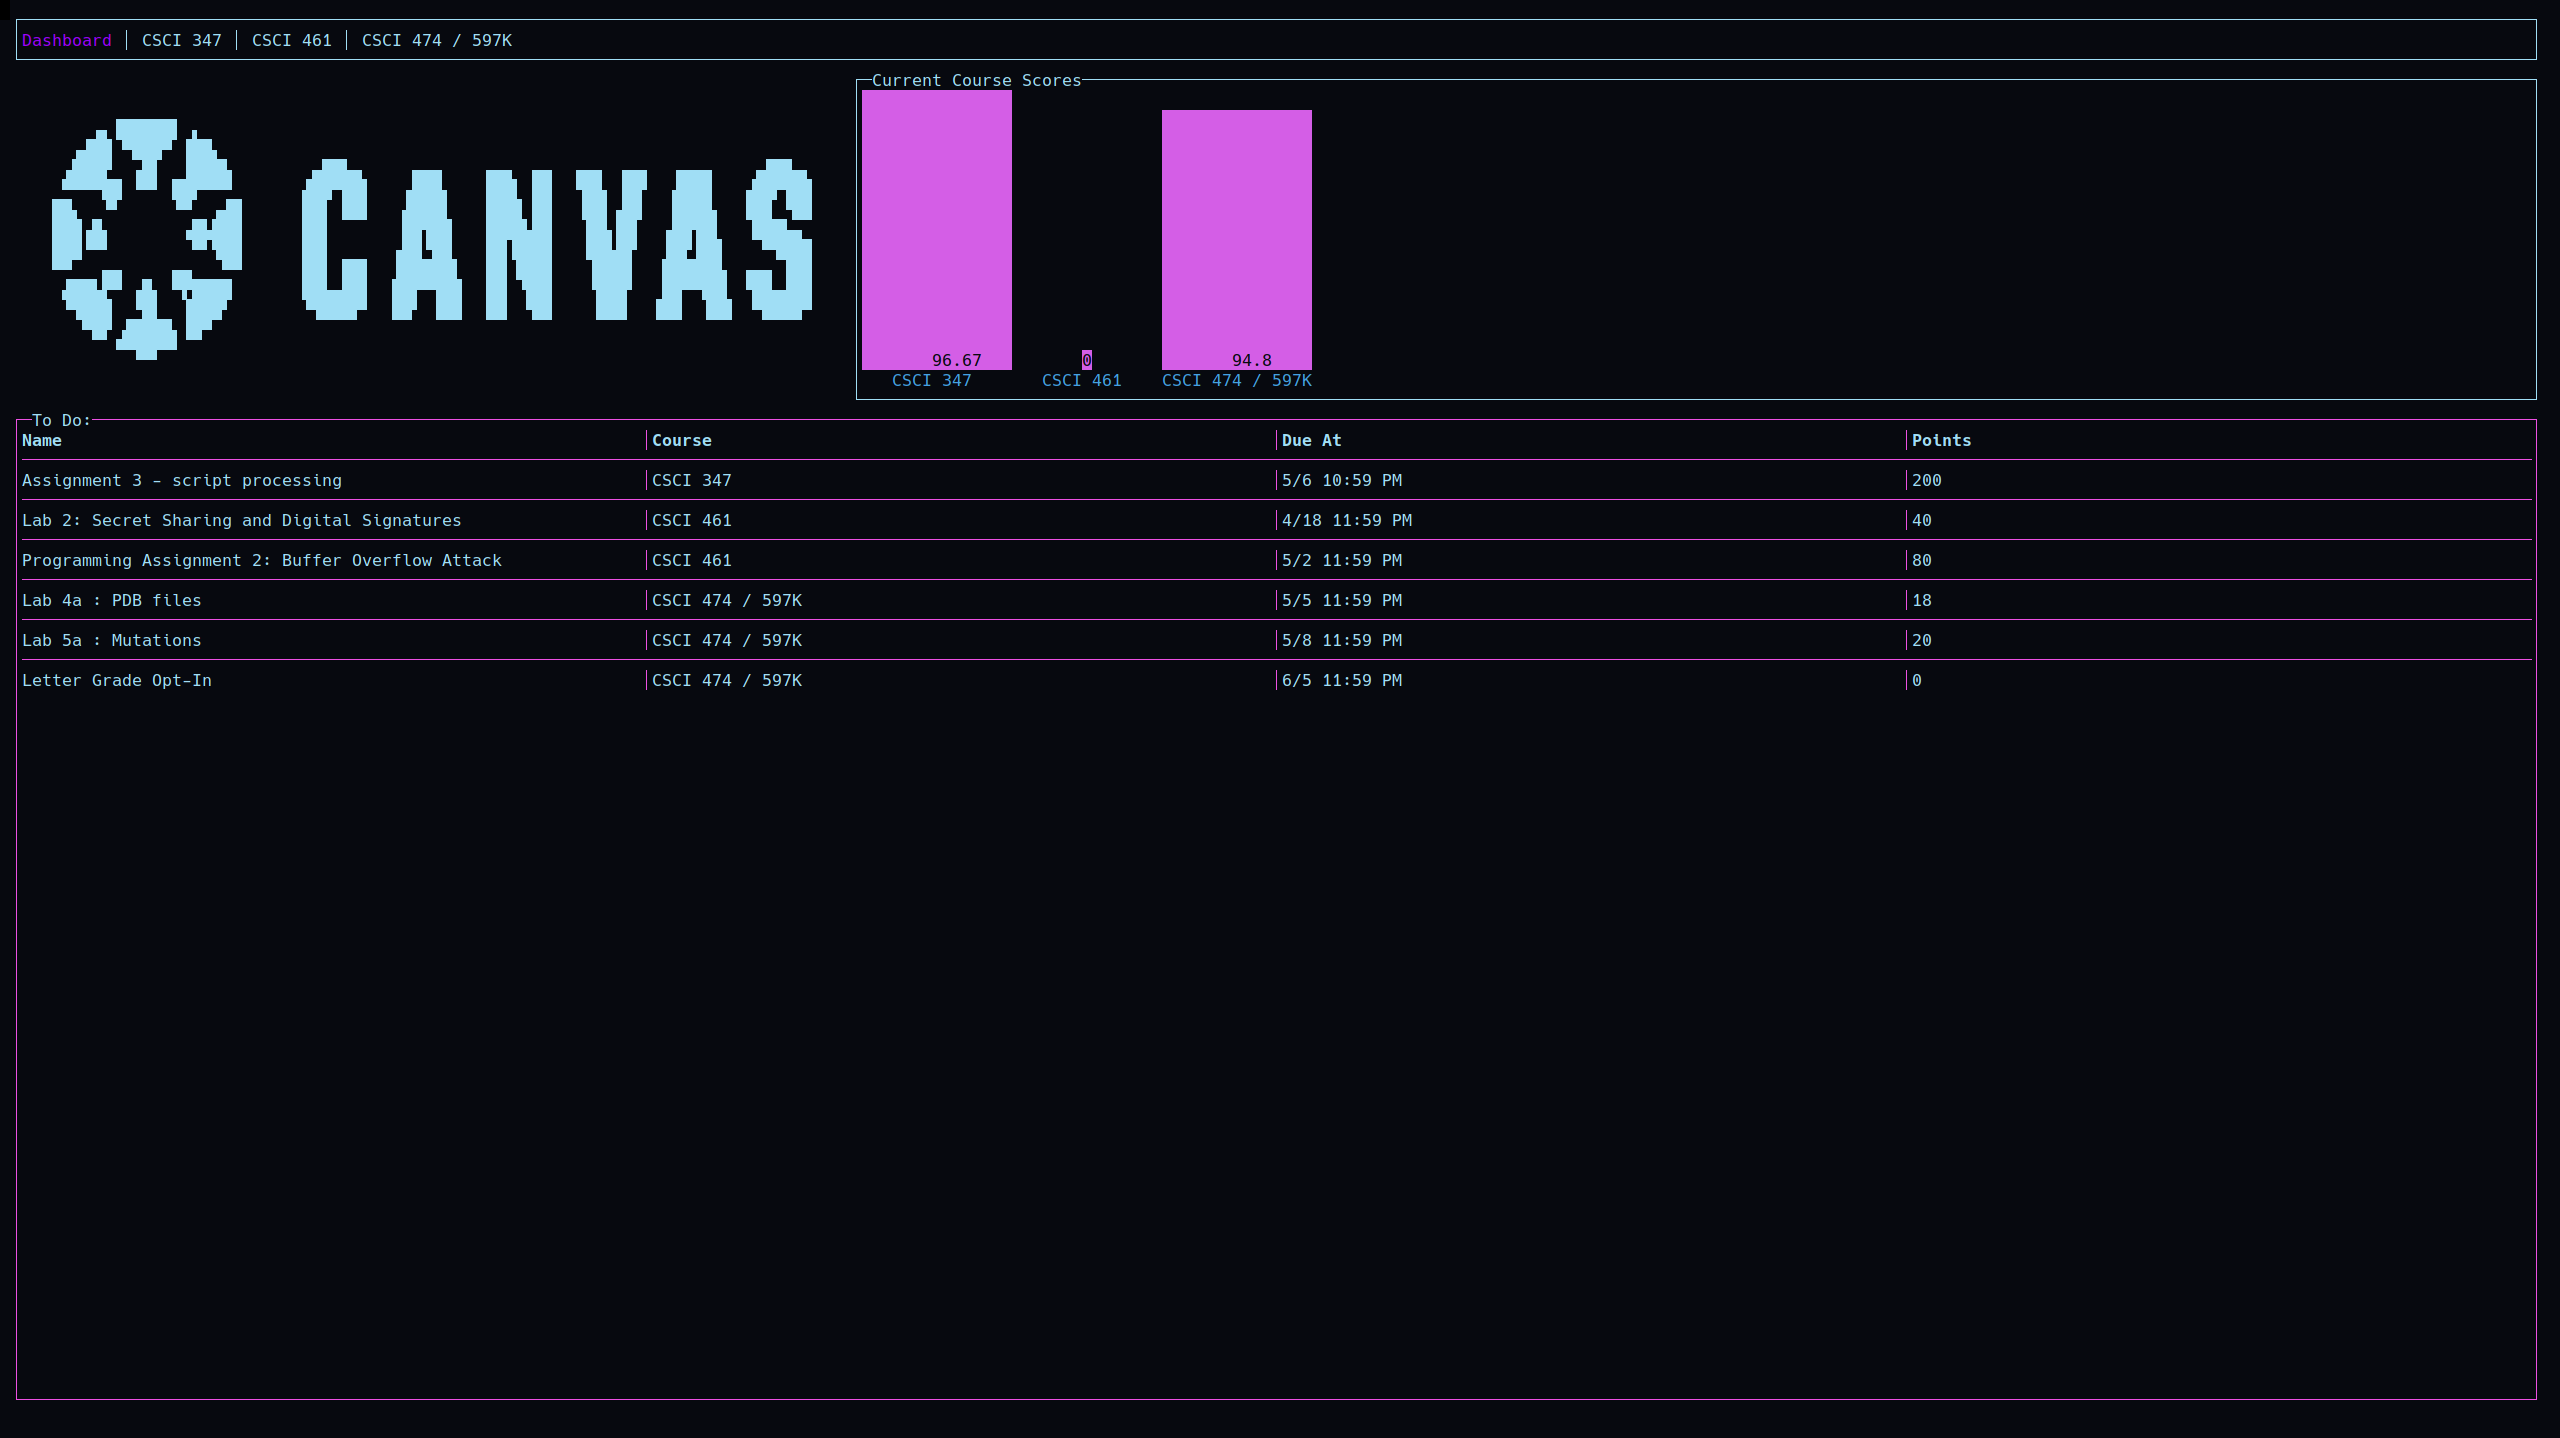
I want this page to be a quick glance at your school status.
So far I have a bar chart that displays your current score in each course, as well as a “To do list”, which is comprised of any outstanding assignments in any class.
Some professors have yet to grade any assignments, causing my “Current Score” to be zero. Many of the features of canvas-tui are impacted by how professors choose to utilize the
Canvas features.
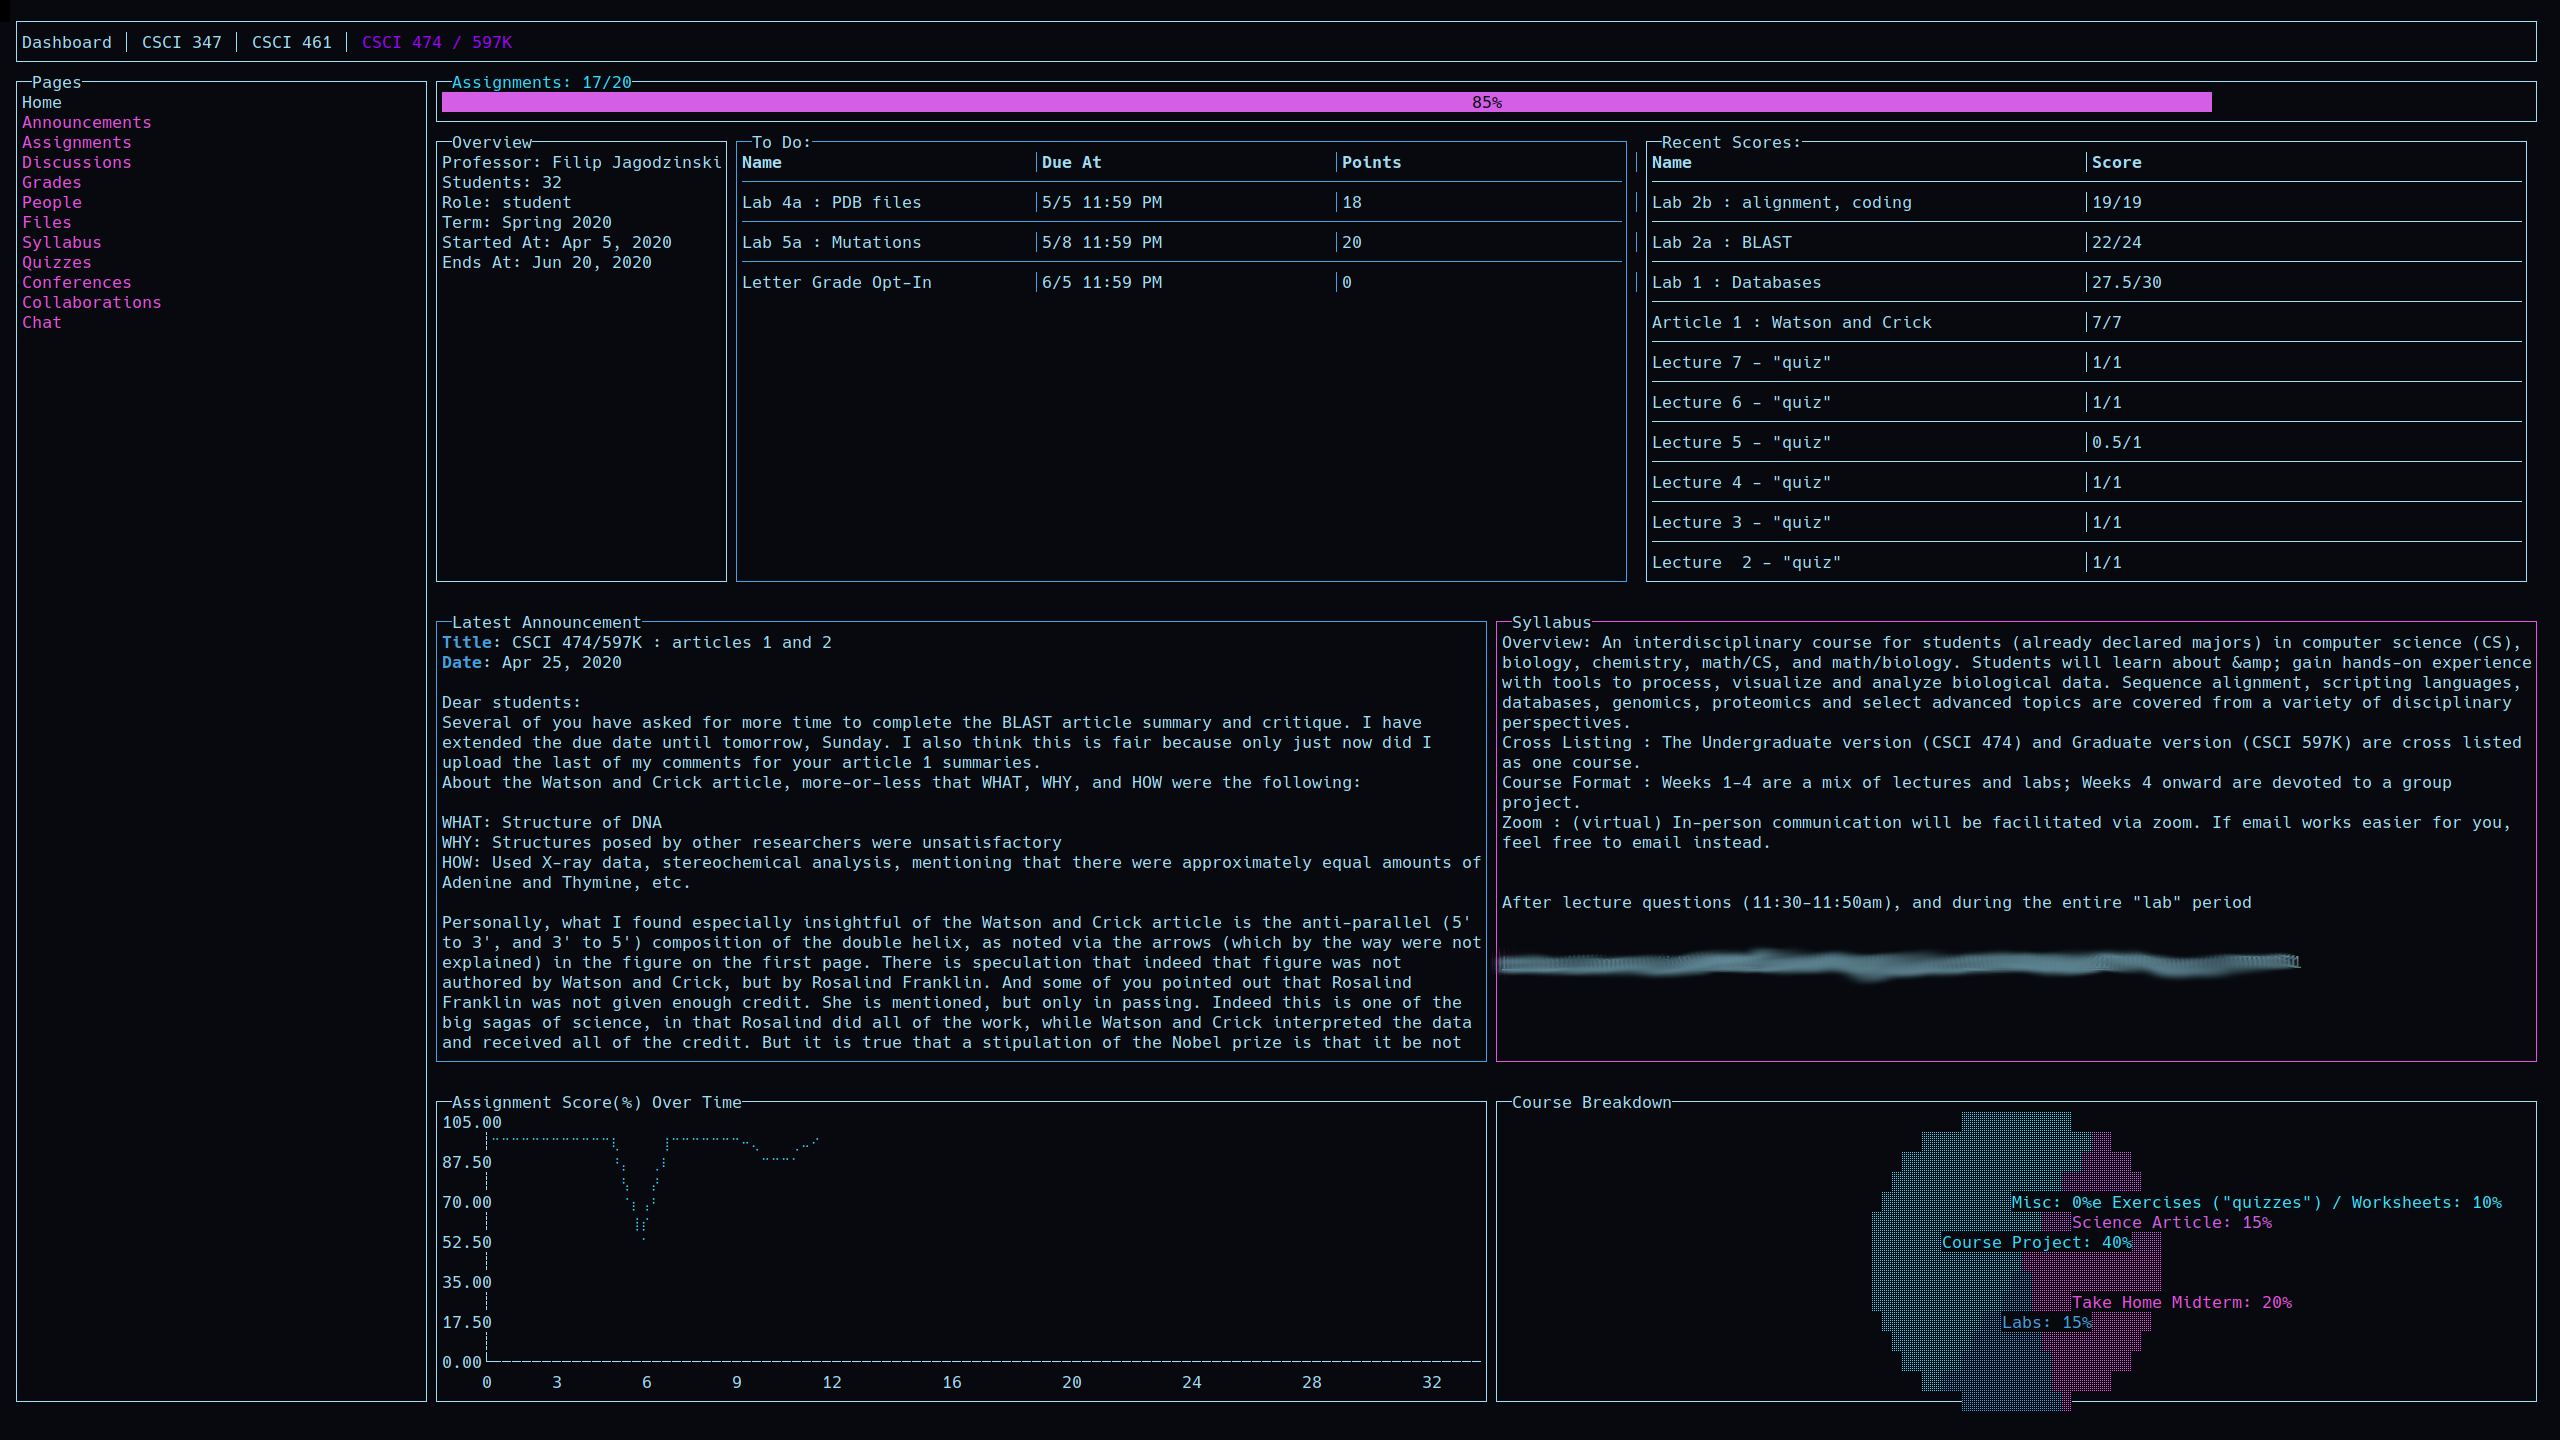
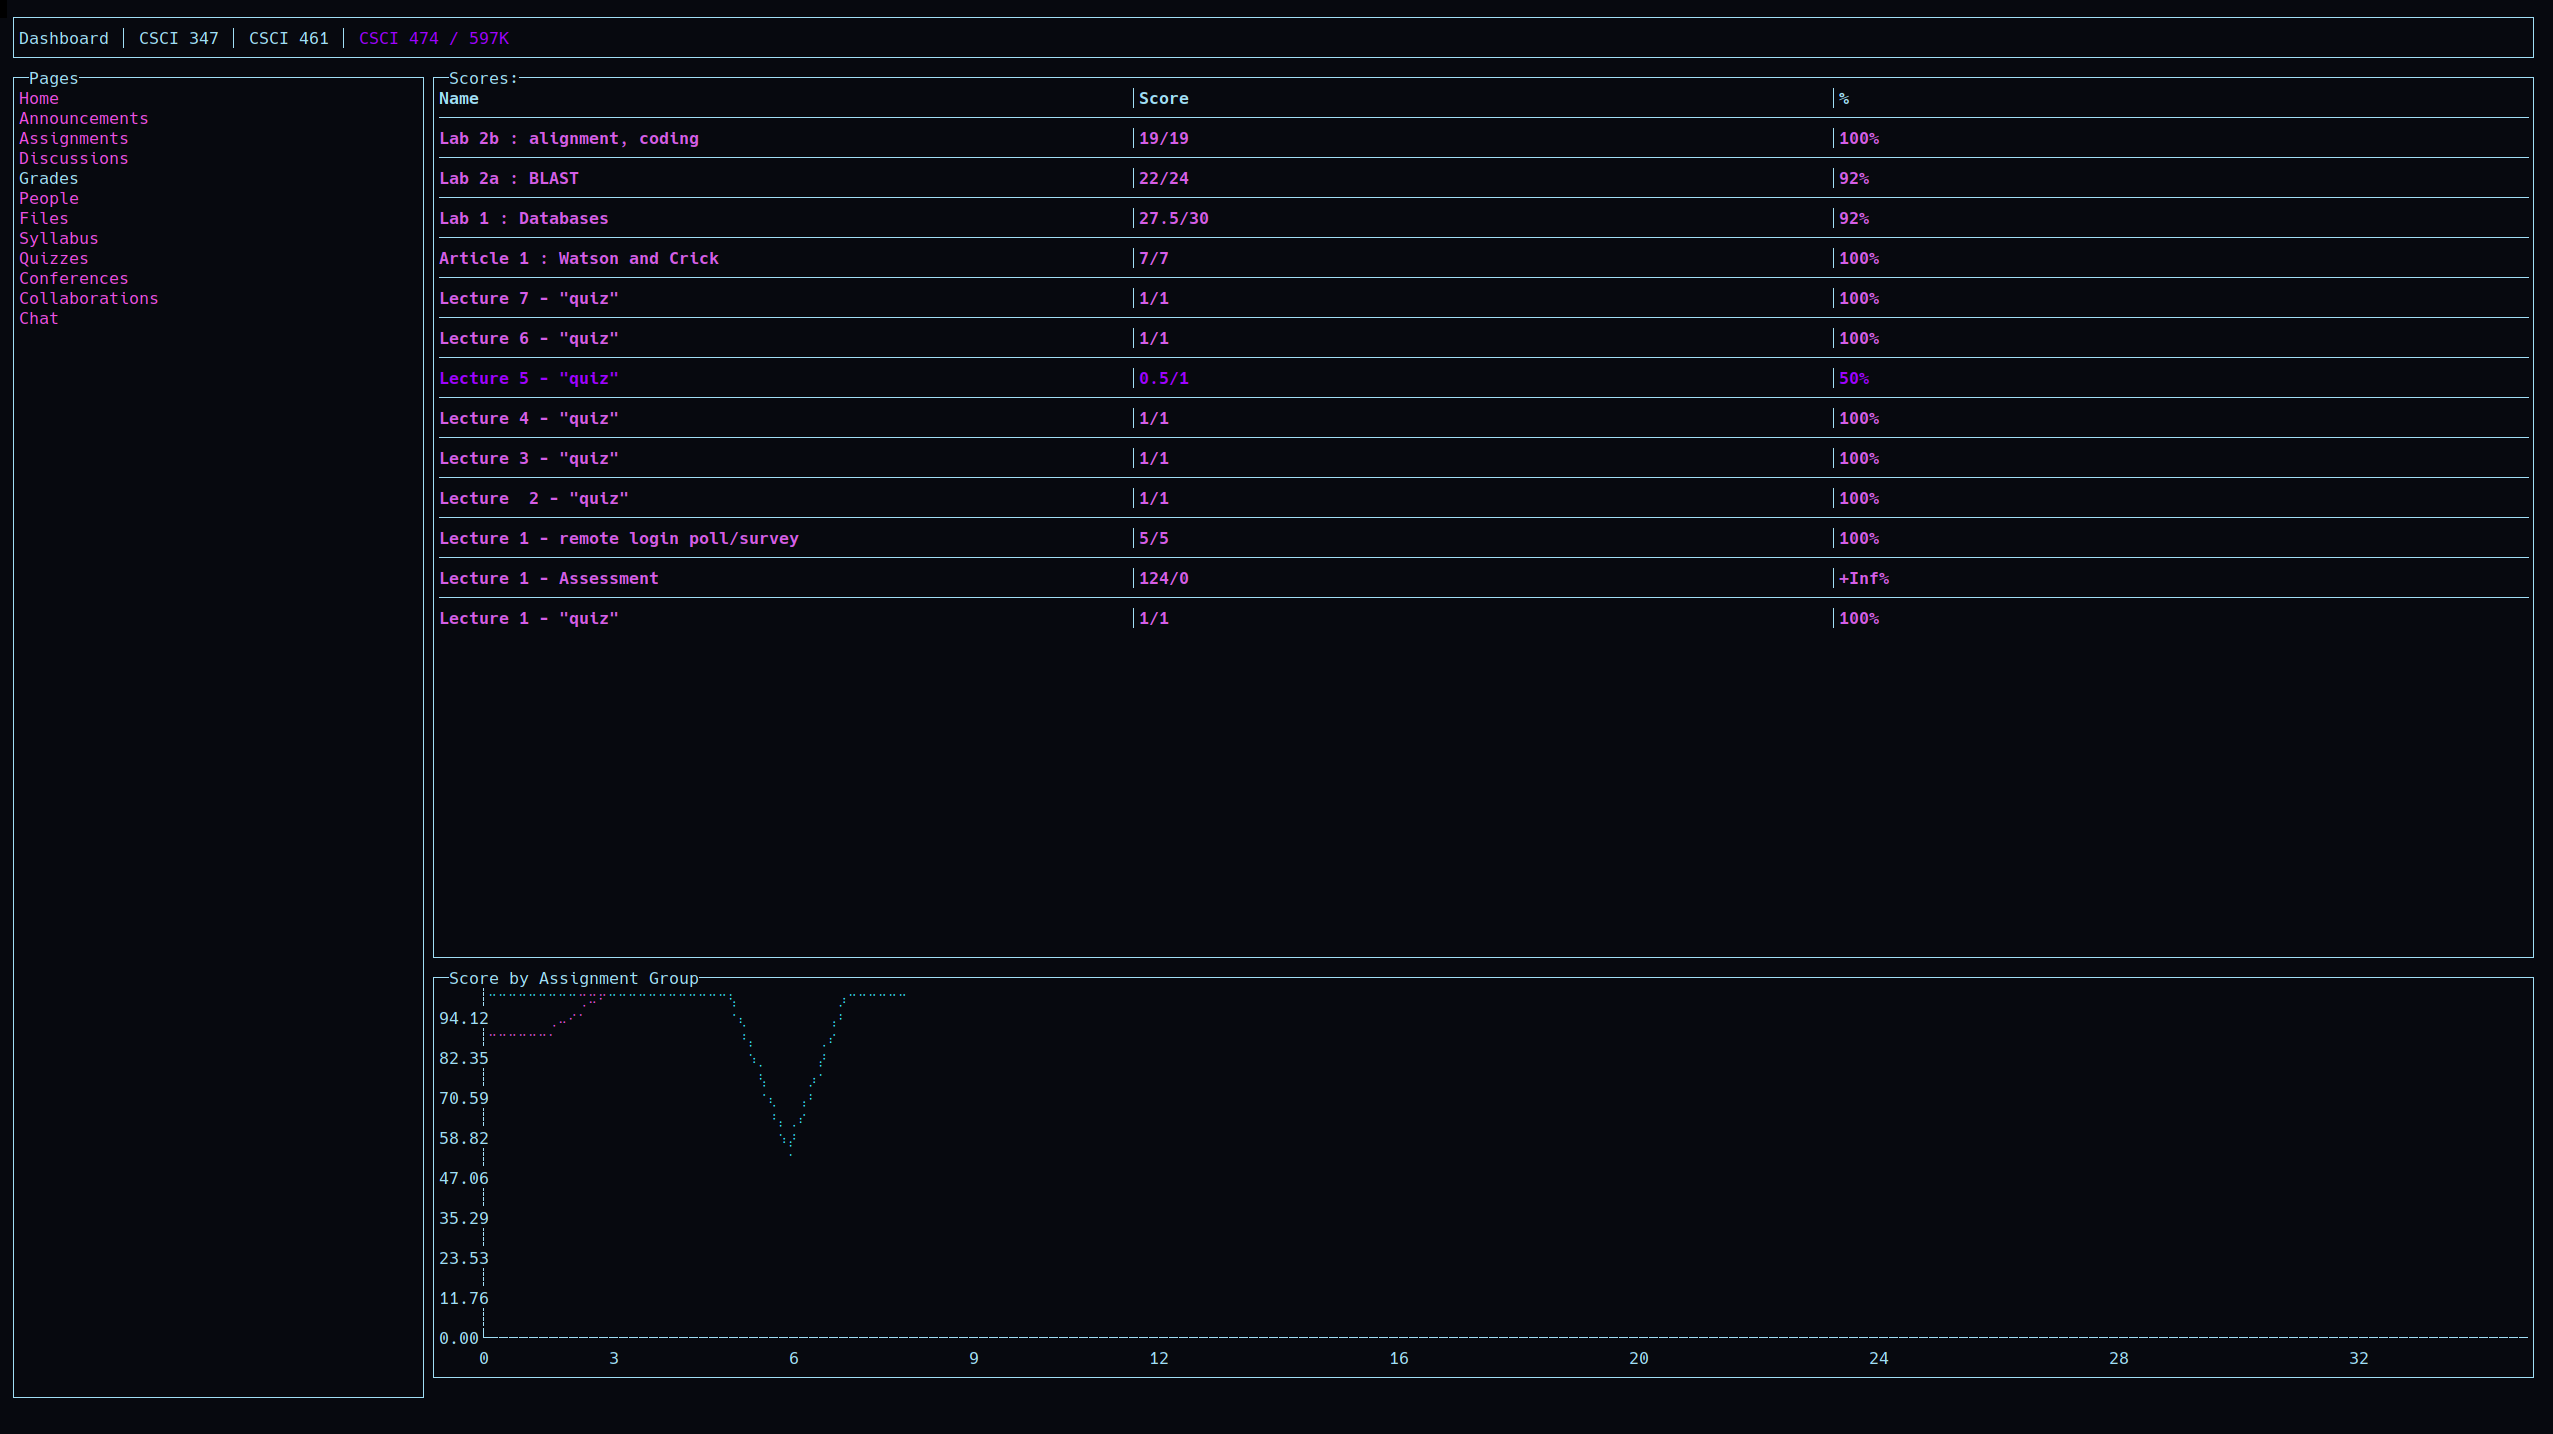
Course Overview⌗
Each course has their own “dashboard” of sorts. My goal here was to display some of the most commonly sought information such as grades and assignments, but also visualize other data about the course, such as the weighting of different assignment groups.

I use this page daily to view the most recent announcement, click on the zoom link for class, or quickly view assignments to complete.
Other Pages⌗
On the lefthand side of the course overview, you will see the navigation menu that can be scrolled using j and k (like civilized people).
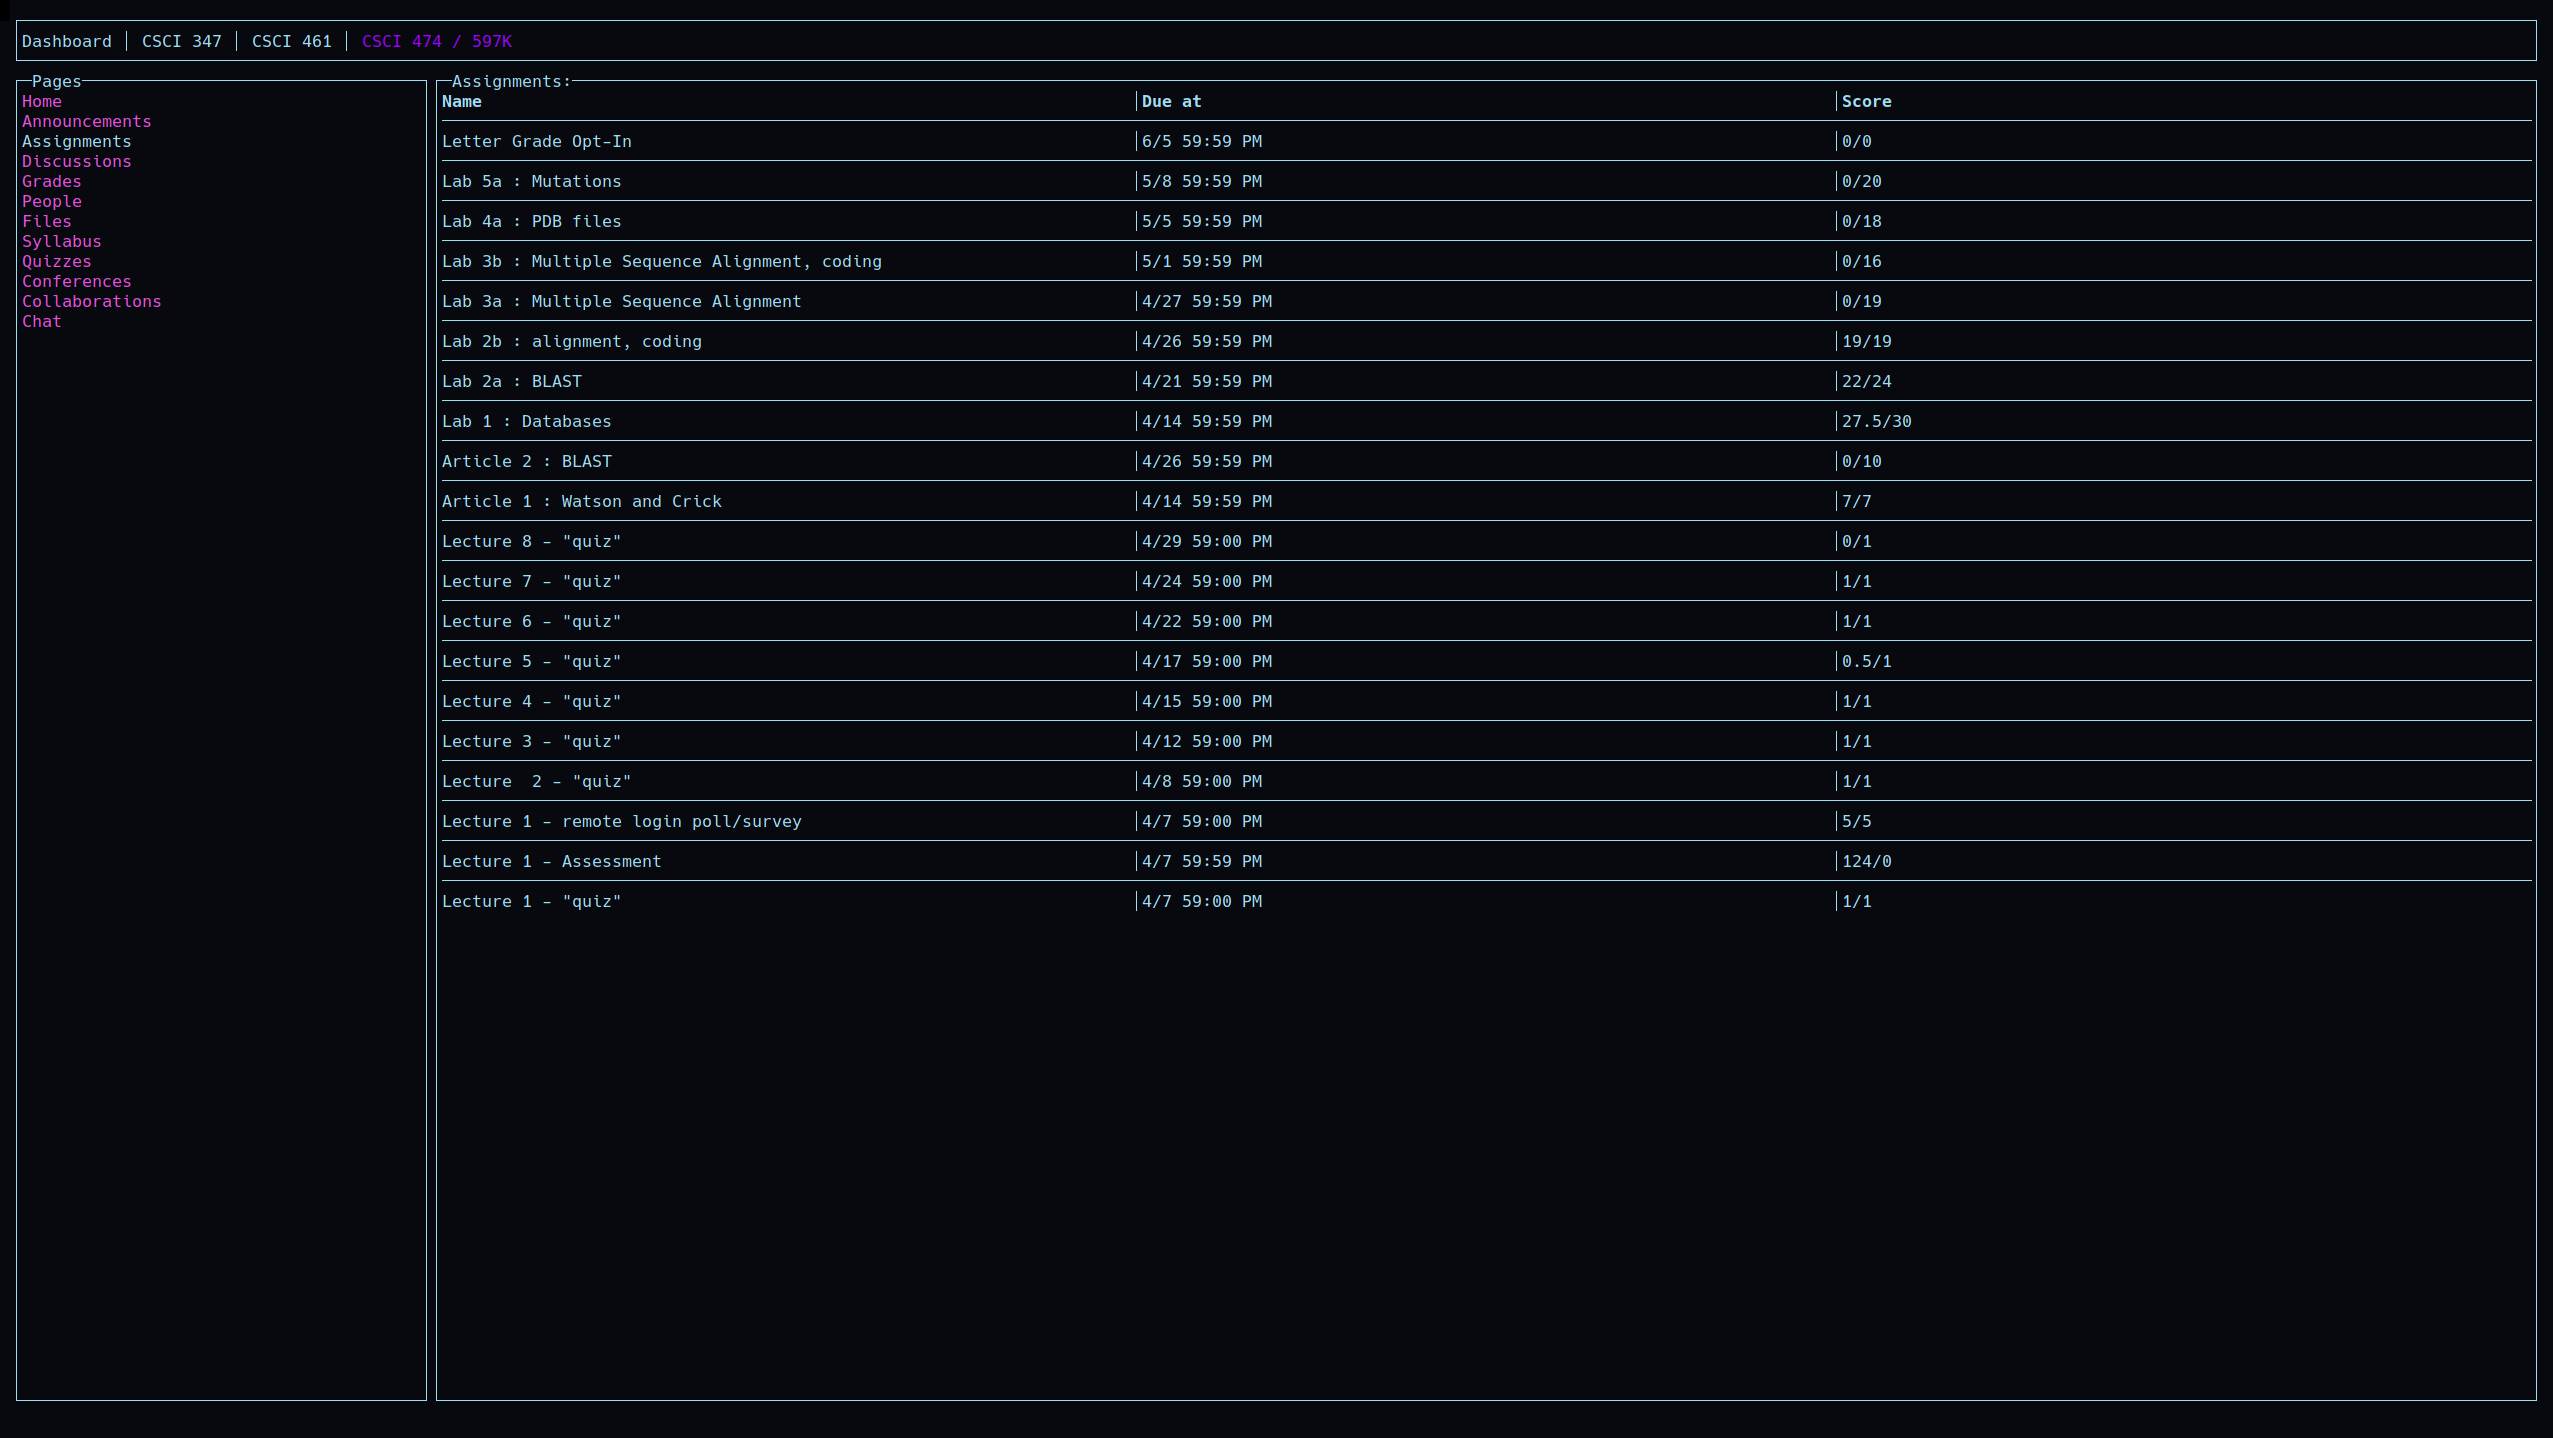
Pressing Space on any of these items will either bring up a placeholder page, or open the dashboard you choose. While I am always thinking of ways to visualize the course tabs in
the terminal, some are not feasible or useful to see there.
That is why after selecting the page you want to view, pressing o will open it in your browser of choice.
The main goal of canvas-tui is to provide statistics and metrics that are usually not provided within the default canvas experience.
Visualizing scores over time, by assignment group, by course, and more are planned additions to the program, as well as whatever else I can wrangle out of the data provided by the Canvas API.
Conclusion⌗
I saw a program that didn’t exist, and wondered why. I realized that was probably because the market for an application like this is practically nonexistent.
I promptly ignored this and set out to create it anyways. At its current form, it does far more than I had initially planned. Nonetheless, I am continually thinking of new features to add, so make sure to stay up to date on the github!