Quantifying Your life: Introduction to the TIG Stack
Introduction⌗
Ever since I was little, I admired the flashy neon-filled screens of fictional tech-wizards, with colorful graphs and charts flying all over place. Since settling into my Linux lifestyle, I had come to terms with the fact that I will be interacting much more with plaintext output logs and debug files than I would be hypnotizing myself with data straight out of NGE.

That was before I found out about the TIG/TICK stack. These software stacks can be used to monitor and visualize pretty much any data input you can imagine. Smart home appliances, sensors, ping stats, CPU usage, stock prices, you name it. There are a few differences between the two stacks, which I will briefly outline:
TICK Stack:
- Telegraf: Scoops up metrics from a huge variety of inputs
- InfluxDB: Stores metrics in a time-series database
- Chronograf: Visualize and interact with the metrics and database
- Kapacitor: Streams data from database and acts on it
These are all programs made by the same company, InfluxData. This stack would probably be my first choice for a production level enterprise environment. This is because the ecosystem is all tied together, and Kapacitor allows you to designate actions to be executed in the case of defined metrics being hit.
However for the home lab usecase, I think the TIG stack is a better fit.
- Telegraf: Scoops up metrics from a huge variety of inputs
- InfluxDB: Stores metrics in a time-series database
- Grafana: Query database and display desired data
With this stack you are still able to see all of your collected data in whatever format you like, but there’s no need to set up an actions/trigger system if you don’t need one. Additionally, I prefer the interface and options provided by Grafana. Let’s start setting stuff up!
A Note About InfluxDB⌗
When I began this project, I opted for the newest version of InfluxDB, V 2.0. Although I knew it was in alpha, I wanted to reduce my technical debt up the road as much as possible. Getting it up and running was fairly easy, and it has a beautiful UI that has much of the dashboarding ability of Grafana.
The only issue is that querying the V2.0 database is quite different than V1, and requires use of the proprietary Flux language. Not that I have anything against this, but V2 and Flux are not widely used/documented, so setting things up would have been frustrating to say the least.
For example, none of the premade dashboards on the community forum (which I relied on to get a feel for how things worked) work with V2.0, and require rewriting the queries from scrath.
For this reason I decided to spin up a V1 database instead, and it works great! The configuration for V2 is already in the file (commented out), so I can hook it up whenever it is in a usable state. The only downside to V1 is that it doesn’t have a web UI to configure things (usually Chronograf is used). The good news is there is minimal configuration required, if any.
Docker⌗
If you’ve read my other posts, you know the drill by now. All these services are going into the Docker stack, so I can easily configure and deploy them anywhere. Here is a
docker-compose.yaml for the TIG stack. A Traefik container is included here because I use it to reverse proxy my services.
version: '3'
services:

#      ____                                   ____
#     / __ \___ _   _____  _____________     / __ \_________  _  ____  __
#    / /_/ / _ \ | / / _ \/ ___/ ___/ _ \   / /_/ / ___/ __ \| |/_/ / / /
#   / _, _/  __/ |/ /  __/ /  (__  )  __/  / ____/ /  / /_/ />  </ /_/ /
#  /_/ |_|\___/|___/\___/_/  /____/\___/  /_/   /_/   \____/_/|_|\__, /
#                                                               /____/

   traefik:
      image: "traefik:v2.0.2"
      container_name: "traefik"
      command:
         - "--log.level=DEBUG"
         - "--api.insecure=true"
         - "--providers.docker=true"
         - "--providers.docker.exposedbydefault=false"
         - "--entrypoints.web.address=:80"
         - "--entrypoints.websecure.address=:443"
         - "--certificatesresolvers.mytlschallenge.acme.tlschallenge=true"
         #- "--certificatesresolvers.mytlschallenge.acme.caserver=https://acme-staging-v02.api.letsencrypt.org/directory"
         - "--certificatesresolvers.mytlschallenge.acme.email=you@yourdomain.com"
         - "--certificatesresolvers.mytlschallenge.acme.storage=/letsencrypt/acme.json"
      ports:
         - "80:80"
         - "8081:8081"
         - "443:443"
      volumes:
         - "/var/run/docker.sock:/var/run/docker.sock:ro"
         - "$HOME/Data/Programs/Docker/TraefikV2/letsencrypt:/letsencrypt"
      networks:
         - traefik
      restart: unless-stopped
      labels:
         - "traefik.http.routers.http-catchall.rule=hostregexp(`{host:.+}`)"
         - "traefik.http.routers.http-catchall.entrypoints=web"
         - "traefik.http.routers.http-catchall.middlewares=redirect-to-https@docker"
         - "traefik.http.middlewares.redirect-to-https.redirectscheme.scheme=https"

#    ________________   _____ __             __
#   /_  __/  _/ ____/  / ___// /_____ ______/ /__
#    / /  / // / __    \__ \/ __/ __ `/ ___/ //_/
#   / / _/ // /_/ /   ___/ / /_/ /_/ / /__/ ,<
#  /_/ /___/\____/   /____/\__/\__,_/\___/_/|_|
#
   grafana:
      image: grafana/grafana
      container_name: grafana
      ports:
         - 3000:3000
      volumes:
         - /home/gideon/Data/Programs/Docker/TIG/Grafana/Data:/var/lib/grafana
      restart: always
      user: "0"
      networks:
         - traefik
      labels:
         - "traefik.enable=true"
         - "traefik.http.routers.grafana.rule=Host(`your.grafana.url`)"
         - "traefik.http.routers.grafana.entrypoints=websecure"
         - "traefik.http.routers.grafana.tls.certresolver=mytlschallenge"
         - "traefik.http.middlewares.grafana.redirectscheme.scheme=https"
      environment:
         - "GF_SERVER_ROOT_URL=your.grafana.url"

   influxdb_V1:
      image: influxdb
      container_name: influxdb_v1
      restart: always
      ports:
         - 8086:8086
      networks:
         - traefik
      volumes:
         - $HOME/Data/Programs/Docker/TIG/InfluxDBV1/:/var/lib/influxdb


   telegraf:
      image: telegraf
      hostname: nas
      volumes:
         - "/:/hostfs:ro"
         - "/etc:/hostfs/etc:ro"
         - "/proc:/hostfs/proc:ro"
         - "/sys:/hostfs/sys:ro"
         - "/var:/hostfs/var:ro"
         - "/run:/hostfs/run:ro"
         #- "/etc/telegraf/telegraf.conf:/etc/telegraf/telegraf.conf"
         - "$HOME/Data/Programs/Docker/TIG/telegraf.conf:/etc/telegraf/telegraf.conf"
         - "/var/run/docker.sock:/var/run/docker.sock:ro"
      environment:
         - "HOST_ETC=/hostfs/etc"
         - "HOST_PROC=/hostfs/proc"
         - "HOST_SYS=/hostfs/sys"
         - "HOST_VAR=/hostfs/var"
         - "HOST_RUN=/hostfs/run"
         - "HOST_MOUNT_PREFIX=/hostfs"
      ports:
         - 8888:8888
      networks: traefik

networks:
  traefik:
    external: true
Telegraf⌗
Telegraf took me a bit to get used to when I first learned it, but now it all makes sense. To get anything useful out of telegraf, you have to use plugins. Using a plugin is as
simple as adding a line to your telegraf.conf file, that is located by default at etc/telegraf. This is where we mounted in the docker container, so you can keep it anywhere on
your local filesystem.
The two types of plugin we need today are input and output. output is pretty simple. We simply need to point our telegraf instance at out database and say “store data
there!”. That can be done with the following code:
# OUTPUTS
[[outputs.influxdb]]
  url = "http://IP.OF.INFLUXDB:8086" # required.
  database = "telegraf" # required.
  precision = "s"
Note: I had to explicitly type my local IP into the url field. localhost did not work for whatever reason…
And that’s it! You could have telegraf broadcast data to multiple locations if you wanted. Next is to configure the input plugins. I will post my config here, but I recommend you
take a look at the list of plugins for some that may suit a usecase you have and I don’t.
The lines below will set up monitoring for the host’s docker environment, as well as system hardware/software statistics. Additionally there are some “fun” plugins to gather data about github repositories, the weather, and more.
# INPUTS
[[inputs.docker]]
  endpoint = "unix:///var/run/docker.sock"
  container_names = []
  timeout = "5s"
  perdevice = true
  ## Whether to report for each container total blkio and network stats or not
  total = false
  ## docker labels to include and exclude as tags.  Globs accepted.
  ## Note that an empty array for both will include all labels as tags
  docker_label_include = []
  docker_label_exclude = []

[[inputs.docker_log]]
  ## Docker Endpoint
  ##   To use TCP, set endpoint = "tcp://[ip]:[port]"
  ##   To use environment variables (ie, docker-machine), set endpoint = "ENV"
  endpoint = "unix:///var/run/docker.sock"

[[inputs.cpu]]
  percpu = true
  totalcpu = true
  # filter all fields beginning with 'time_'
  fielddrop = ["time_*"]

[[inputs.disk]]
  [inputs.disk.tagpass]
    # tagpass conditions are OR, not AND.
    # If the (filesystem is ext4 or xfs) OR (the path is /opt or /home)
    # then the metric passes
    fstype = [ "ext4", "xfs" ]
    # Globs can also be used on the tag values
    path = [ "/opt", "/home*" ]

[[inputs.diskio]]

[[inputs.kernel]]

[[inputs.net]]

[[inputs.netstat]]

[[inputs.nstat]]

# Collect response time of a TCP or UDP connection
[[inputs.net_response]]
  ## Protocol, must be "tcp" or "udp"
  ## NOTE: because the "udp" protocol does not respond to requests, it requires
  ## a send/expect string pair (see below).
  protocol = "tcp"
  ## Server address (default localhost)
  address = "localhost:80"

[[inputs.processes]]

[[inputs.sensors]]

[[inputs.swap]]

[[inputs.mem]]

[[inputs.internal]]

[[inputs.interrupts]]

[[inputs.temp]]

[[inputs.wireless]]

[[inputs.bond]]

# This plugin gets dns information/response time from configured domains.
# Super helpful for checking status of service or machine
[[inputs.dns_query]]
  ## servers to query
  servers = ["8.8.8.8"]
  domains = ["exampledomain.tld"]

[[inputs.system]]

[[inputs.github]]
  ## List of repositories to monitor
  repositories = [
	  "GideonWolfe/vim.reaper",
	  "GideonWolfe/gideonwolfe.com"
  ]

  ## Github API access token.  Unauthenticated requests are limited to 60 per hour.
  access_token = "YOUR_TOKEN_HERE"

[[inputs.openweathermap]]
  ## OpenWeatherMap API key.
  app_id = "YOUR_KEY_HERE"

  ## City ID's to collect weather data from.
  city_id = ["098008"]

  ## APIs to fetch; can contain "weather" or "forecast".
  fetch = ["weather", "forecast"]

  ## Preferred unit system for temperature and wind speed. Can be one of
  ## "metric", "imperial", or "standard".
  # units = "metric"

  ## Query interval; OpenWeatherMap weather data is updated every 10
  ## minutes.
  interval = "10m"
And that’s it! I’m always on the lookout for cool plugins and ways to integrate my data into telegraf.
InfluxDB⌗
This is the quickest set up by far. Simply get a shell inside the influx docker container with docker exec -it <container-name> bash. Run influx to start the interactive
database prompt.
Create a user with the following command:
CREATE USER <username> WITH PASSWORD <password> WITH ALL PRIVILEGES
Then add a database with this one:
CREATE DATABASE telegraf
If you want to add a data retention policy, do it like so:
CREATE RETENTION POLICY “keep_x_days” ON “telegraf” DURATION xd REPLICATION 1
where x is the amount of days you want InfluxDB to keep your data.
Bring it all up⌗
The only thing to do now is bring the whole thing up with docker-compose.
To start out, bring the stack up with docker-compose up so you can read the logs and identify possible configuration errors. If everything is going as planned, you should be able
to access your Grafana instance at http://localhost:3000. Additionally, telegraf should be feeding into the InfluxDB container without error.
Grafana⌗
The first step for setting up Grafana is adding InfluxDB as a data source, so you can actually start getting some data. Go to Configuration > Data Sources > Add data source and
fill in the details for your InfluxDB instance. Since Grafana is querying a database that isn’t exposed to the internet and instead running on the local system, we can skip the
security settings for now and simply enter in the IP of our database, the database name (which should be telegraf), and the credentials for the user we just created.
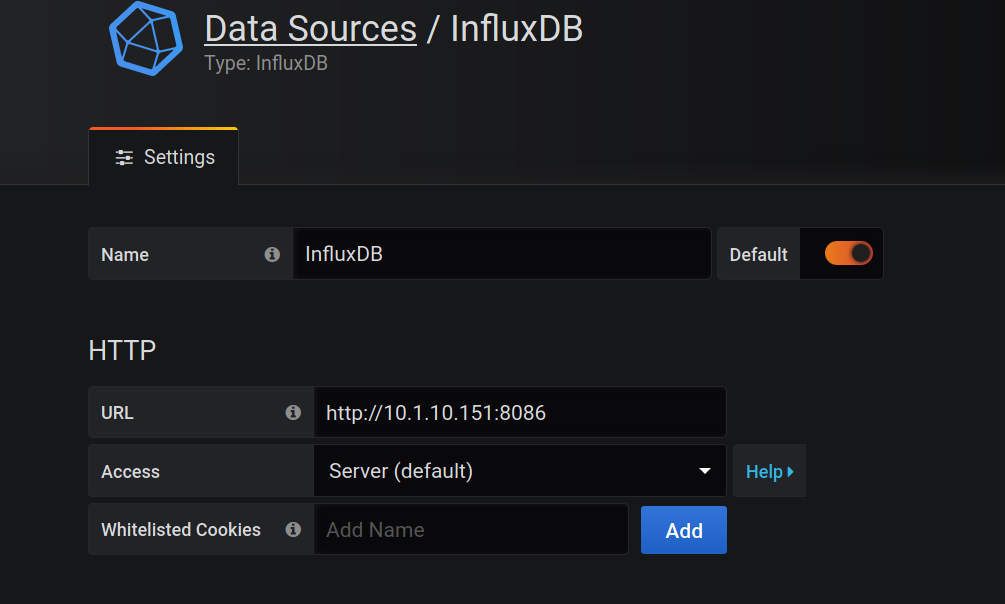
If this was set up correctly, the Save & Test button will let you know. Next, we should download some panels. Browse the Grafana panel plugin
list to find ones that you want. The last part of the url of the page of each panel is it’s id.
grafana-cli plugins install <plugin_id>
Now these added panels will show up in the menus. You can add datasources the same way, but they don’t seem to show up unless you manually add and enable them through the GUI as well.
The next step is where the real fun begins; adding dashboards. I would also recommend checking out the other available datasources, because there are some neat ones that don’t require any installation.
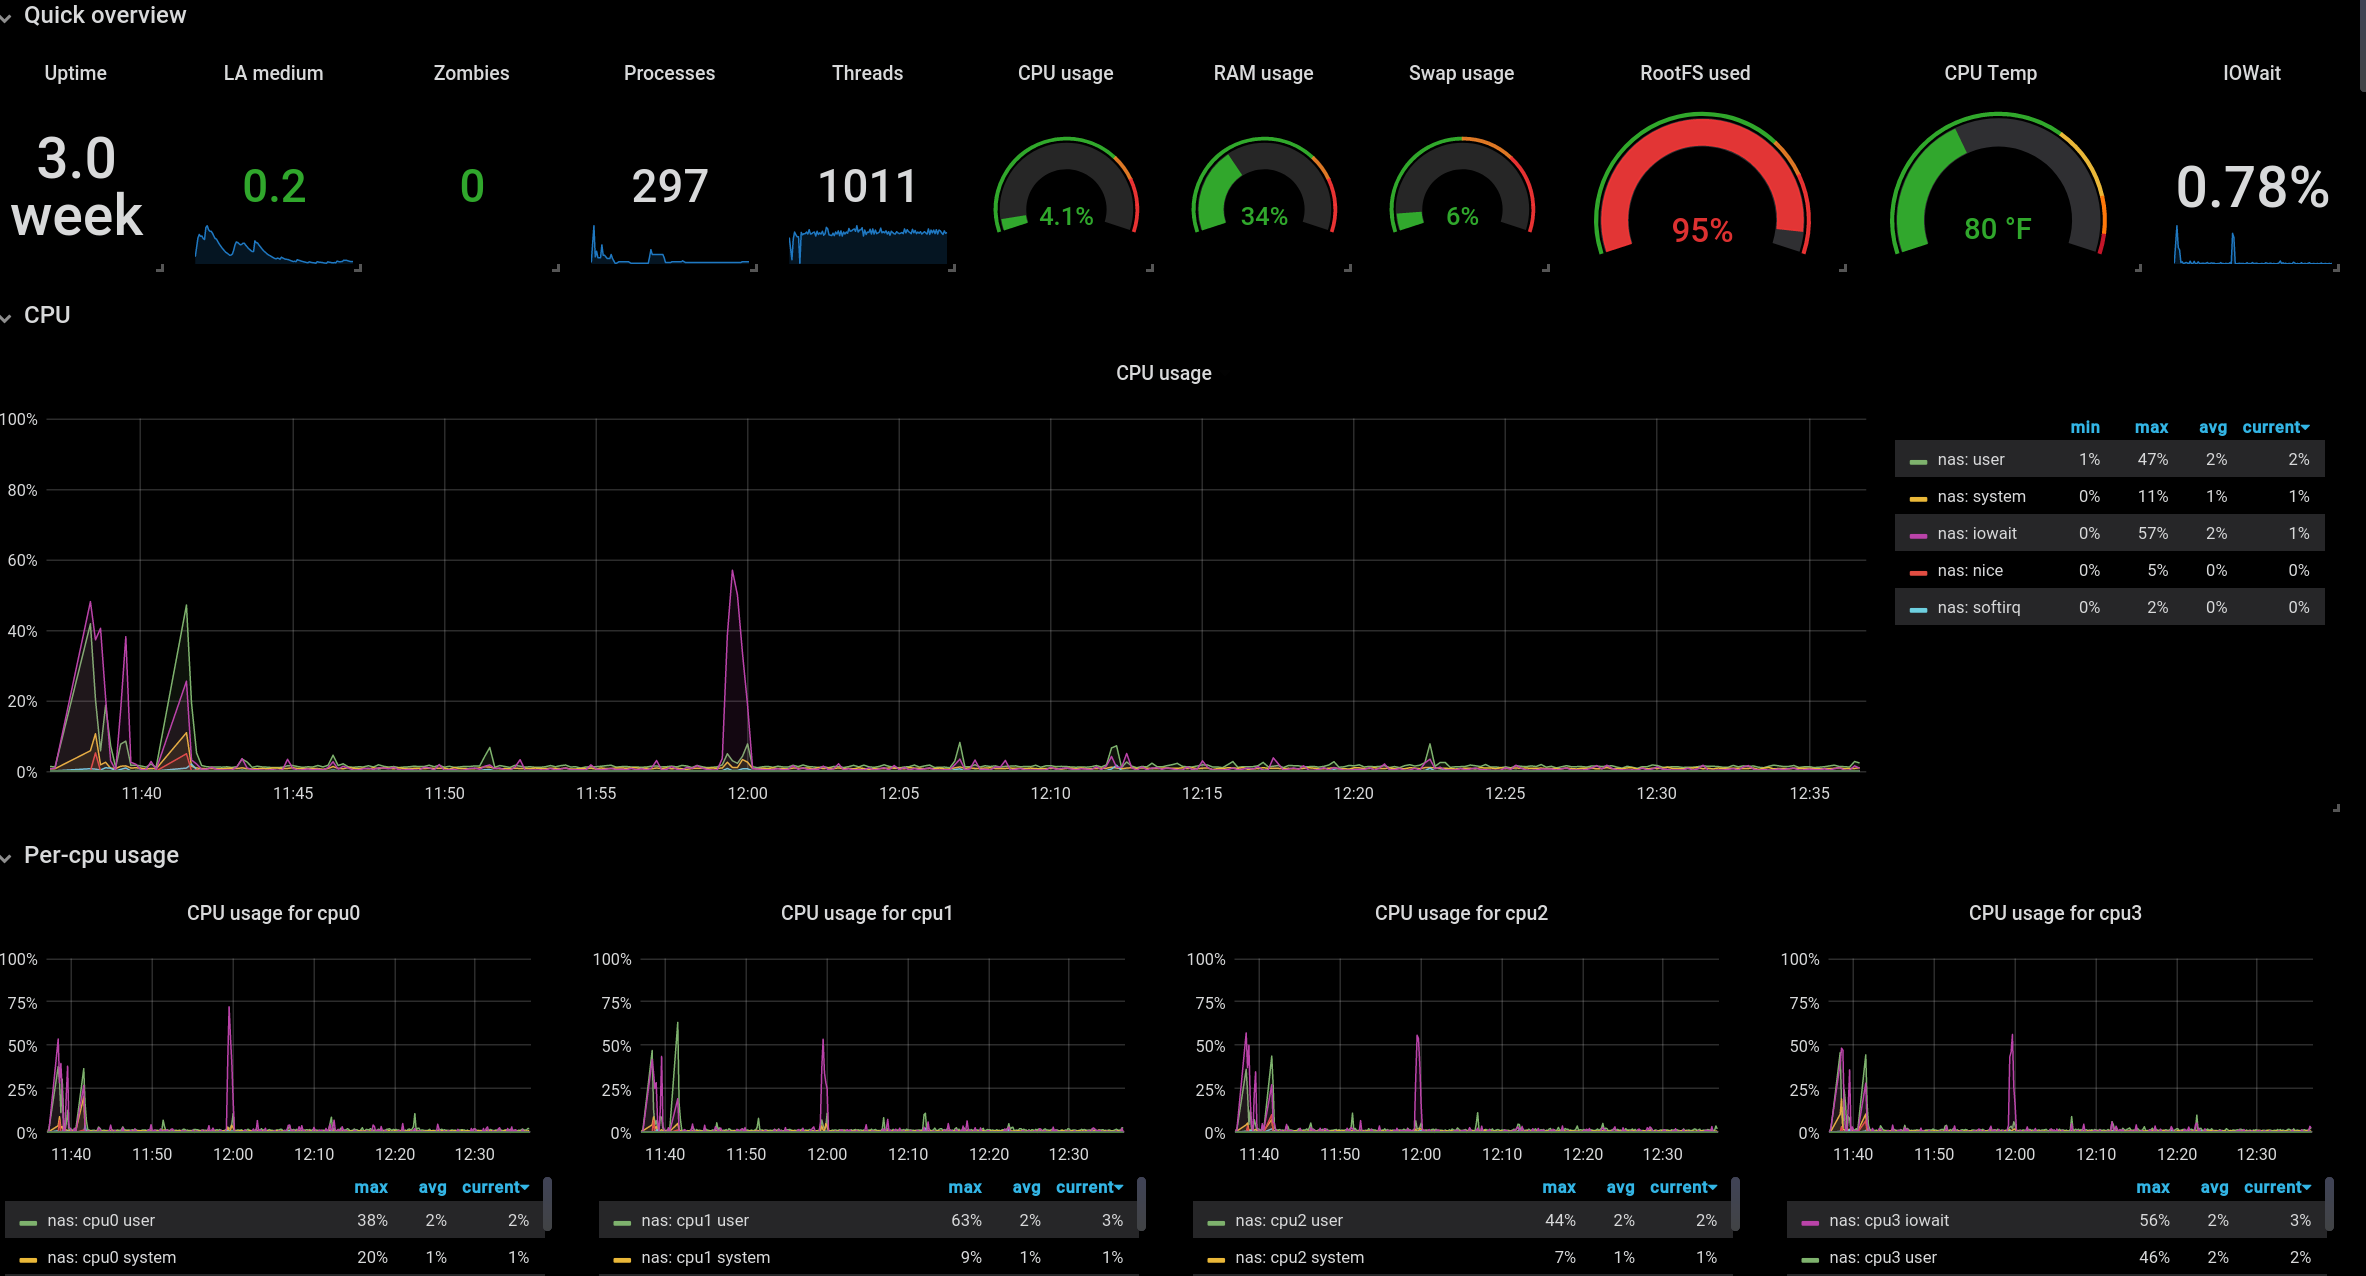
If you’re a complete novice at this like I was, browse some community dashboards to get inspired. I will briefly show you how to set up a simple CPU monitor dashboard, but the more advanced stuff will be for a later tutorial.
Click the “New Panel” icon at the top right of your dashboard. Then click “add query”. Here is the basic idea of how your queries should be structured. You can click on each field to see the possible values, and explore the metrics collected by your various input plugins.
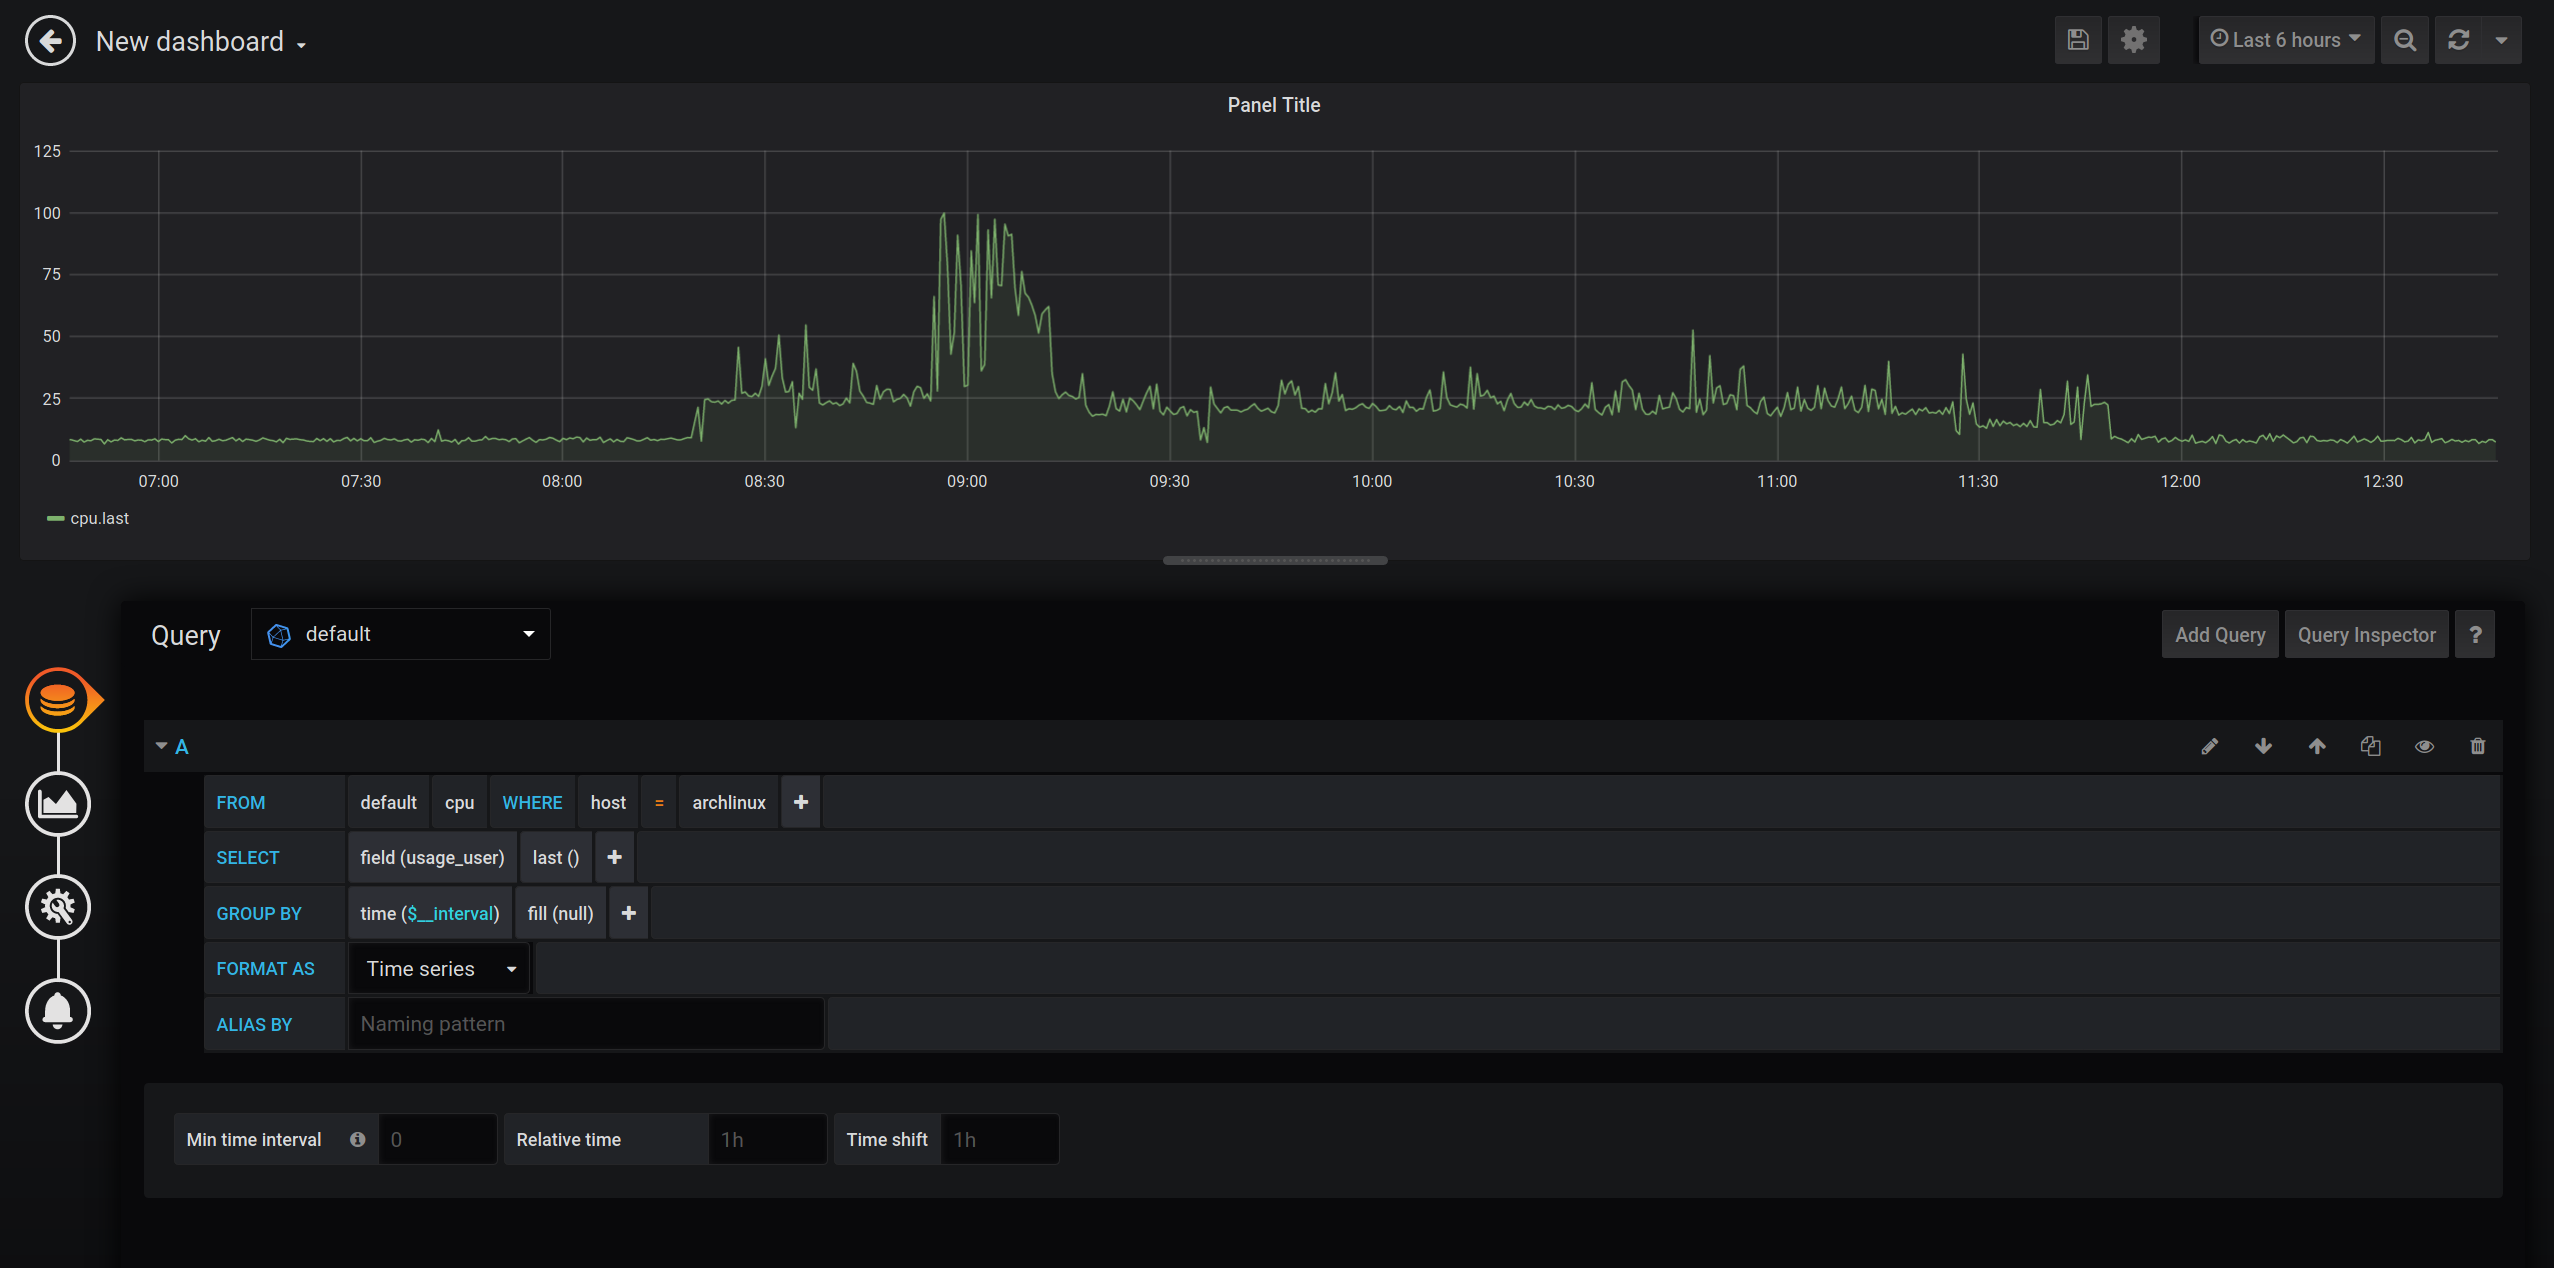
Play around with the visualization settings, and the various configuration options each one has. Community dashboards are a great way to get inspired for what you should include on yours.
Conclusion⌗
In this post I showed you how to get the TIG stack up and running with docker. This software stack allows you to collect metrics from one or more machines, store this metrics in a purpose built database, and display these metrics in a beautiful fashion with customizable dashboards and panels.
In my next post I will give some examples of advanced database queries, live diagrams, and customized dashboards.