Theming gnuplot
Overview⌗
If you have read any of my other posts, you know how important it is to have a cohesive looking system. I recently developed Zathura-Pywal, a tool that recolors PDFs in zathura based on your colorscheme.
In that same vein, I have whipped up a set of scripts to do the same thing for gnuplot. If you haven’t heard of gnuplot, check out my short tutorial here.
How to install⌗
git clone https://github.com/GideonWolfe/Gnuplot-Pywal
cd Gnuplot-Pywal
sudo ./install.sh
Now here’s the thing to remember. Instead of running gnuplot, you now have to run gplot to get the freshly themed config. You can mess with the aliases however you like, but the config generation script must be called.
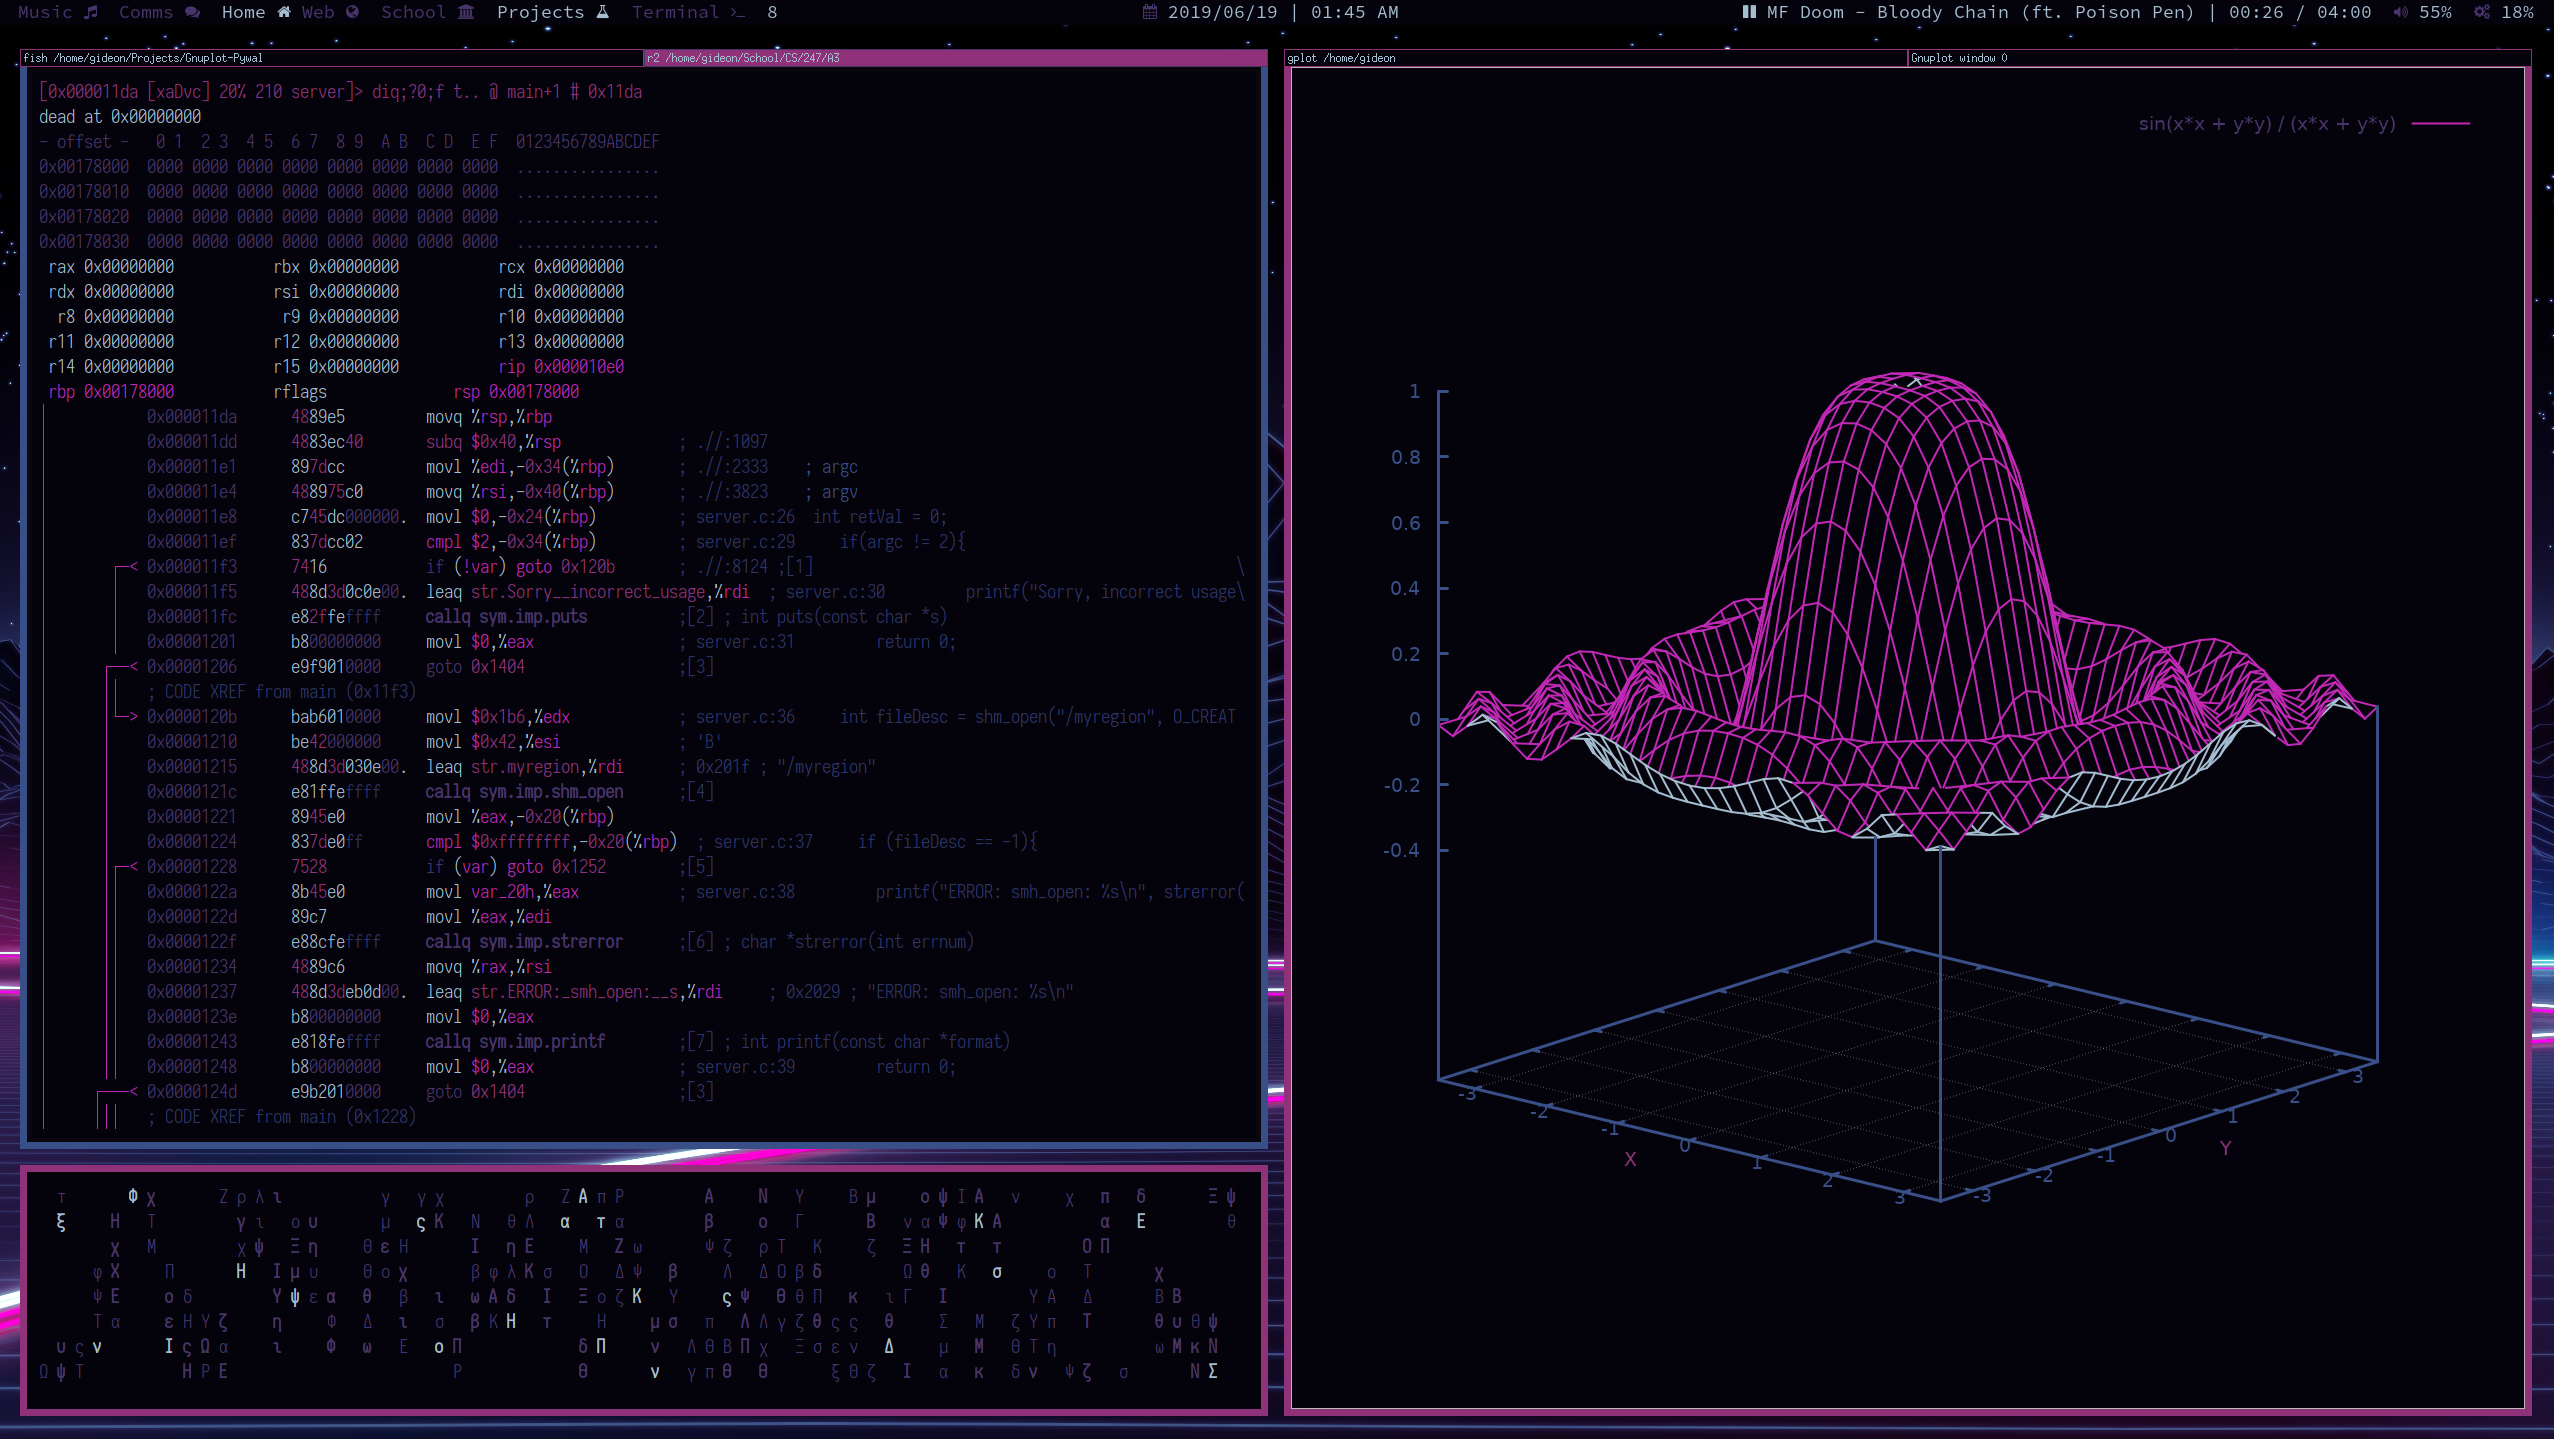
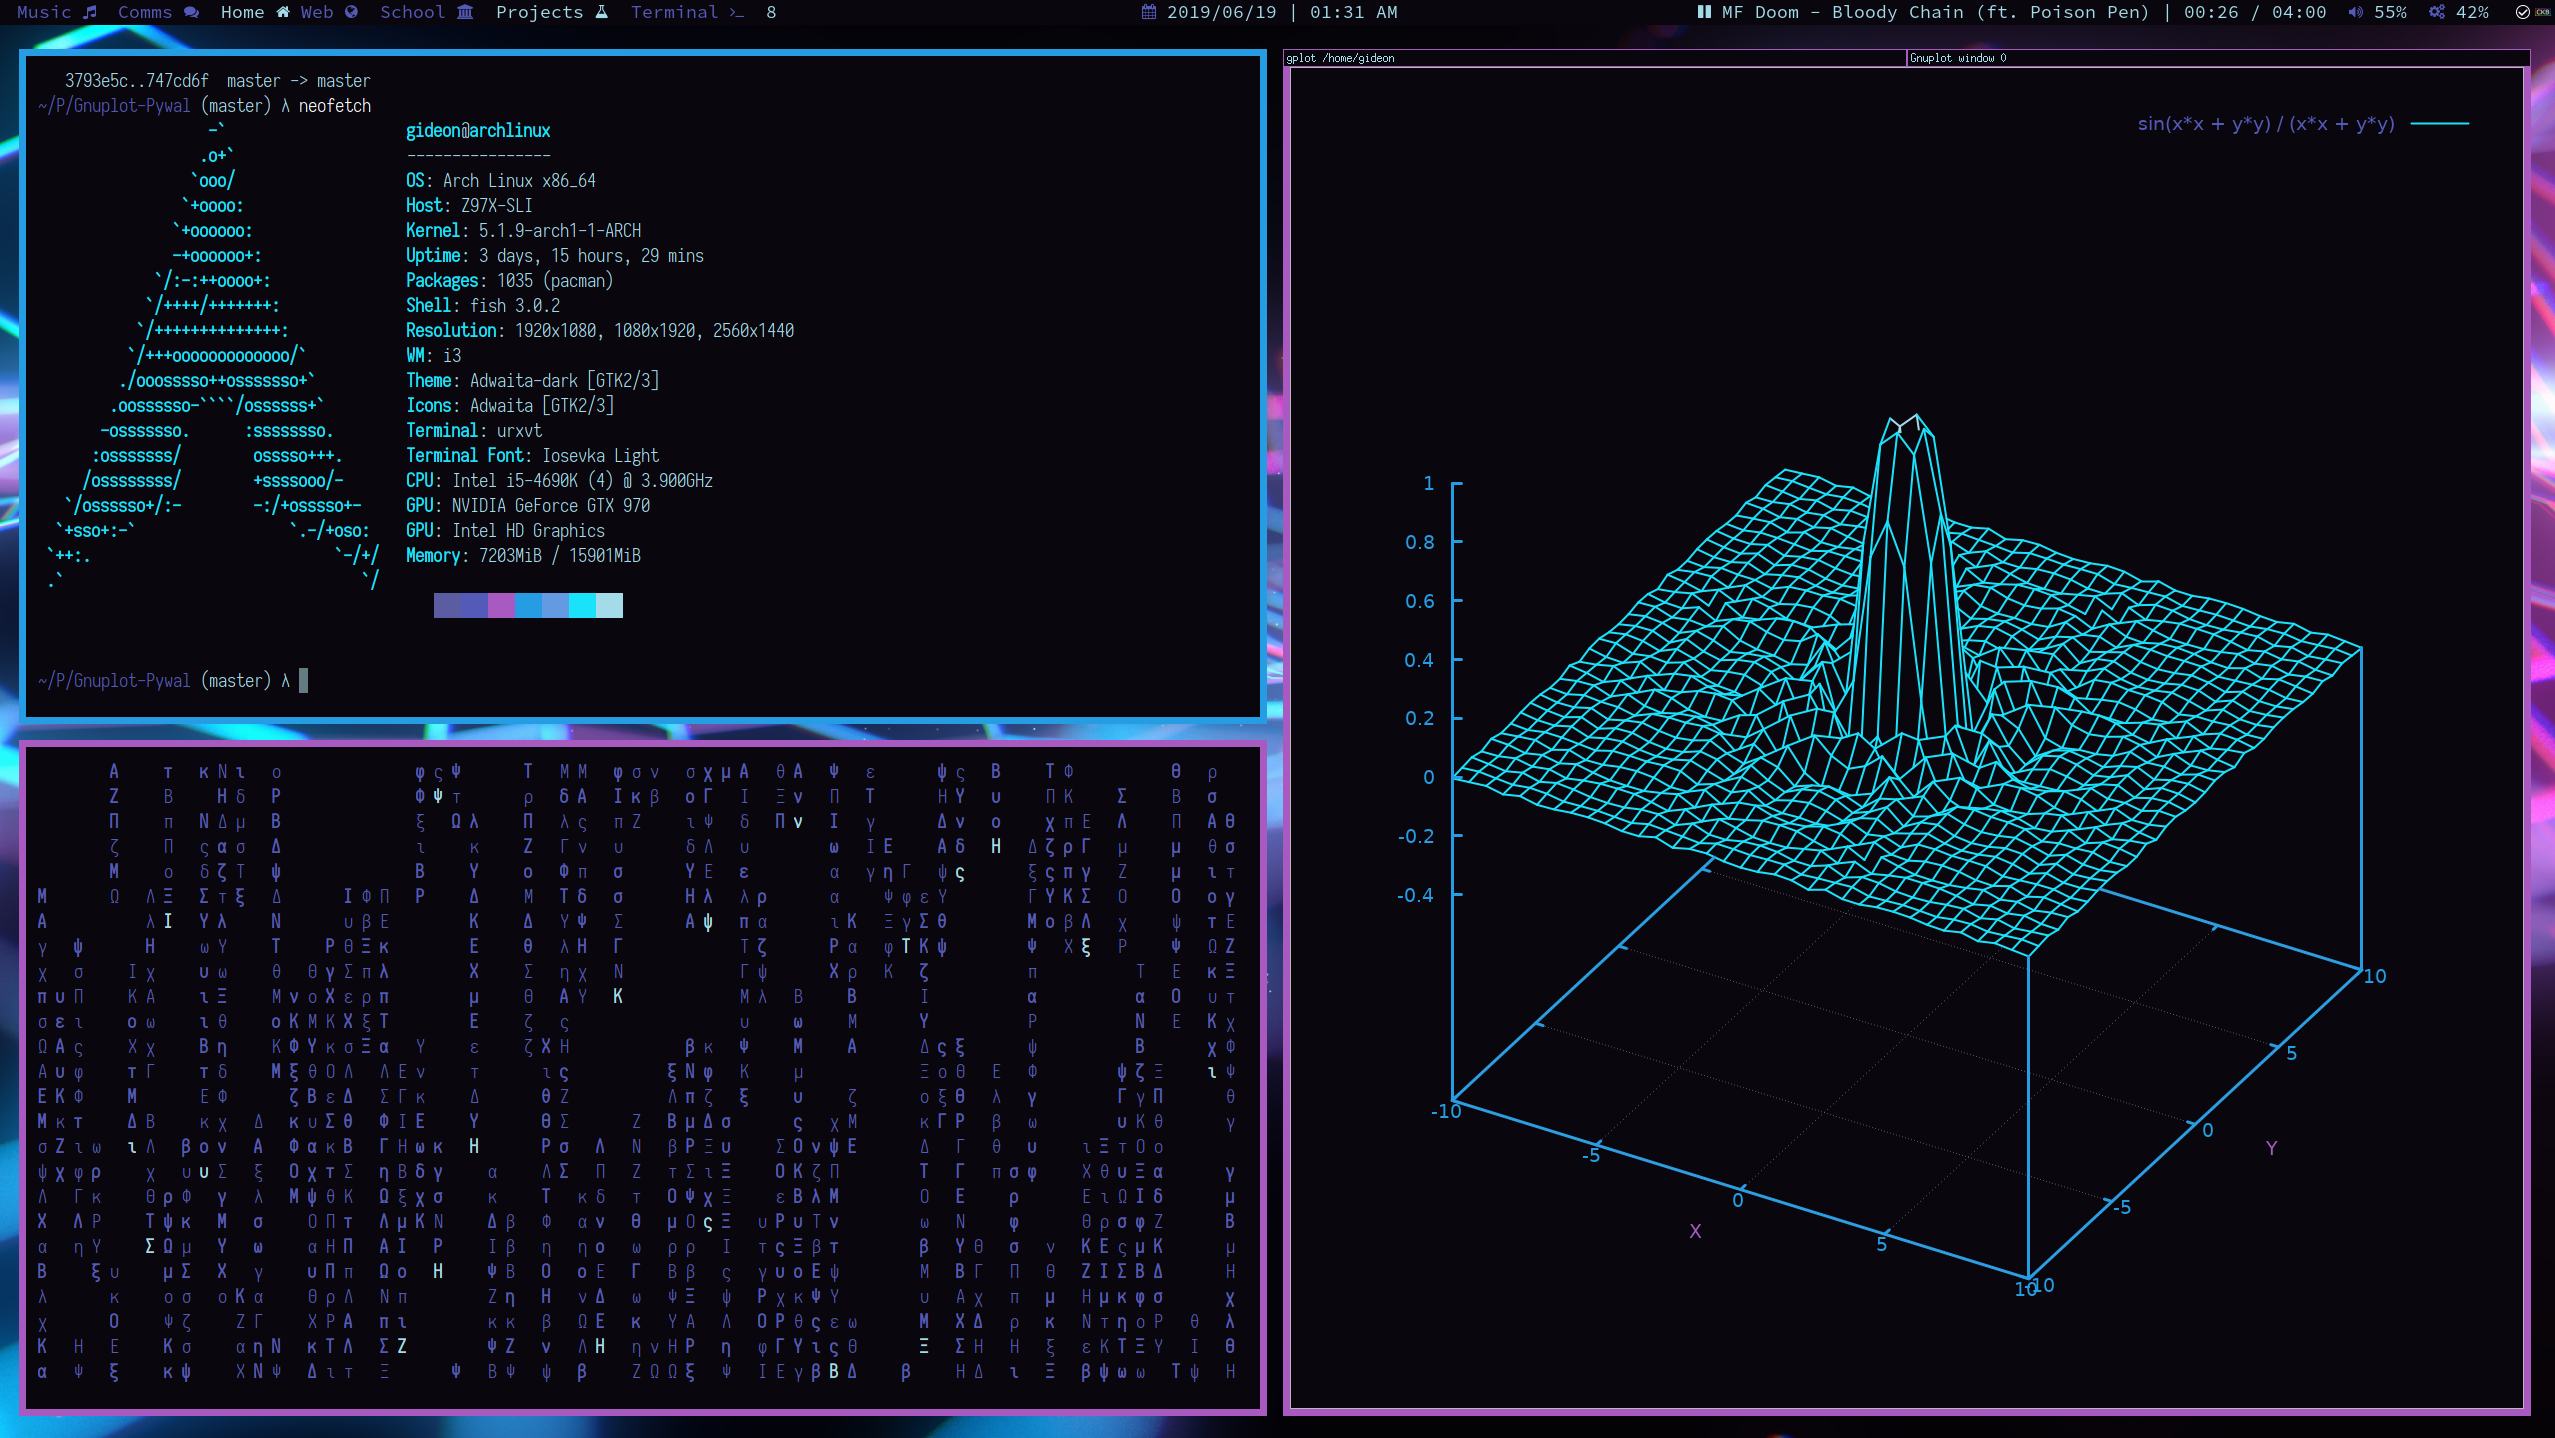 $$ \frac{sin(x^2 + y^2)}{x^2 + y^2} $$
How it works⌗
These are pretty short scripts, so I’ll be brief. When the command gplot is run, it immediately calls another program gengnuplotconfig. Aside from some optional tinkering, you should never have to interact with this program.
When gengnuplotconfig is called, it imports colors from a cache created by pywal. It then pipes out a gnuplot configuration, using color values from your colorscheme. These can be tweaked to your preference.
in gplot, the output of gengnuplotconfig is being redirected into the file ~/.gnuplot, which is the default configuration file used by gnuplot.
Finally with this new configuration in place, gnuplot is launched. The delay is imperceptible and the colorscheme usually comes out looking pretty good.
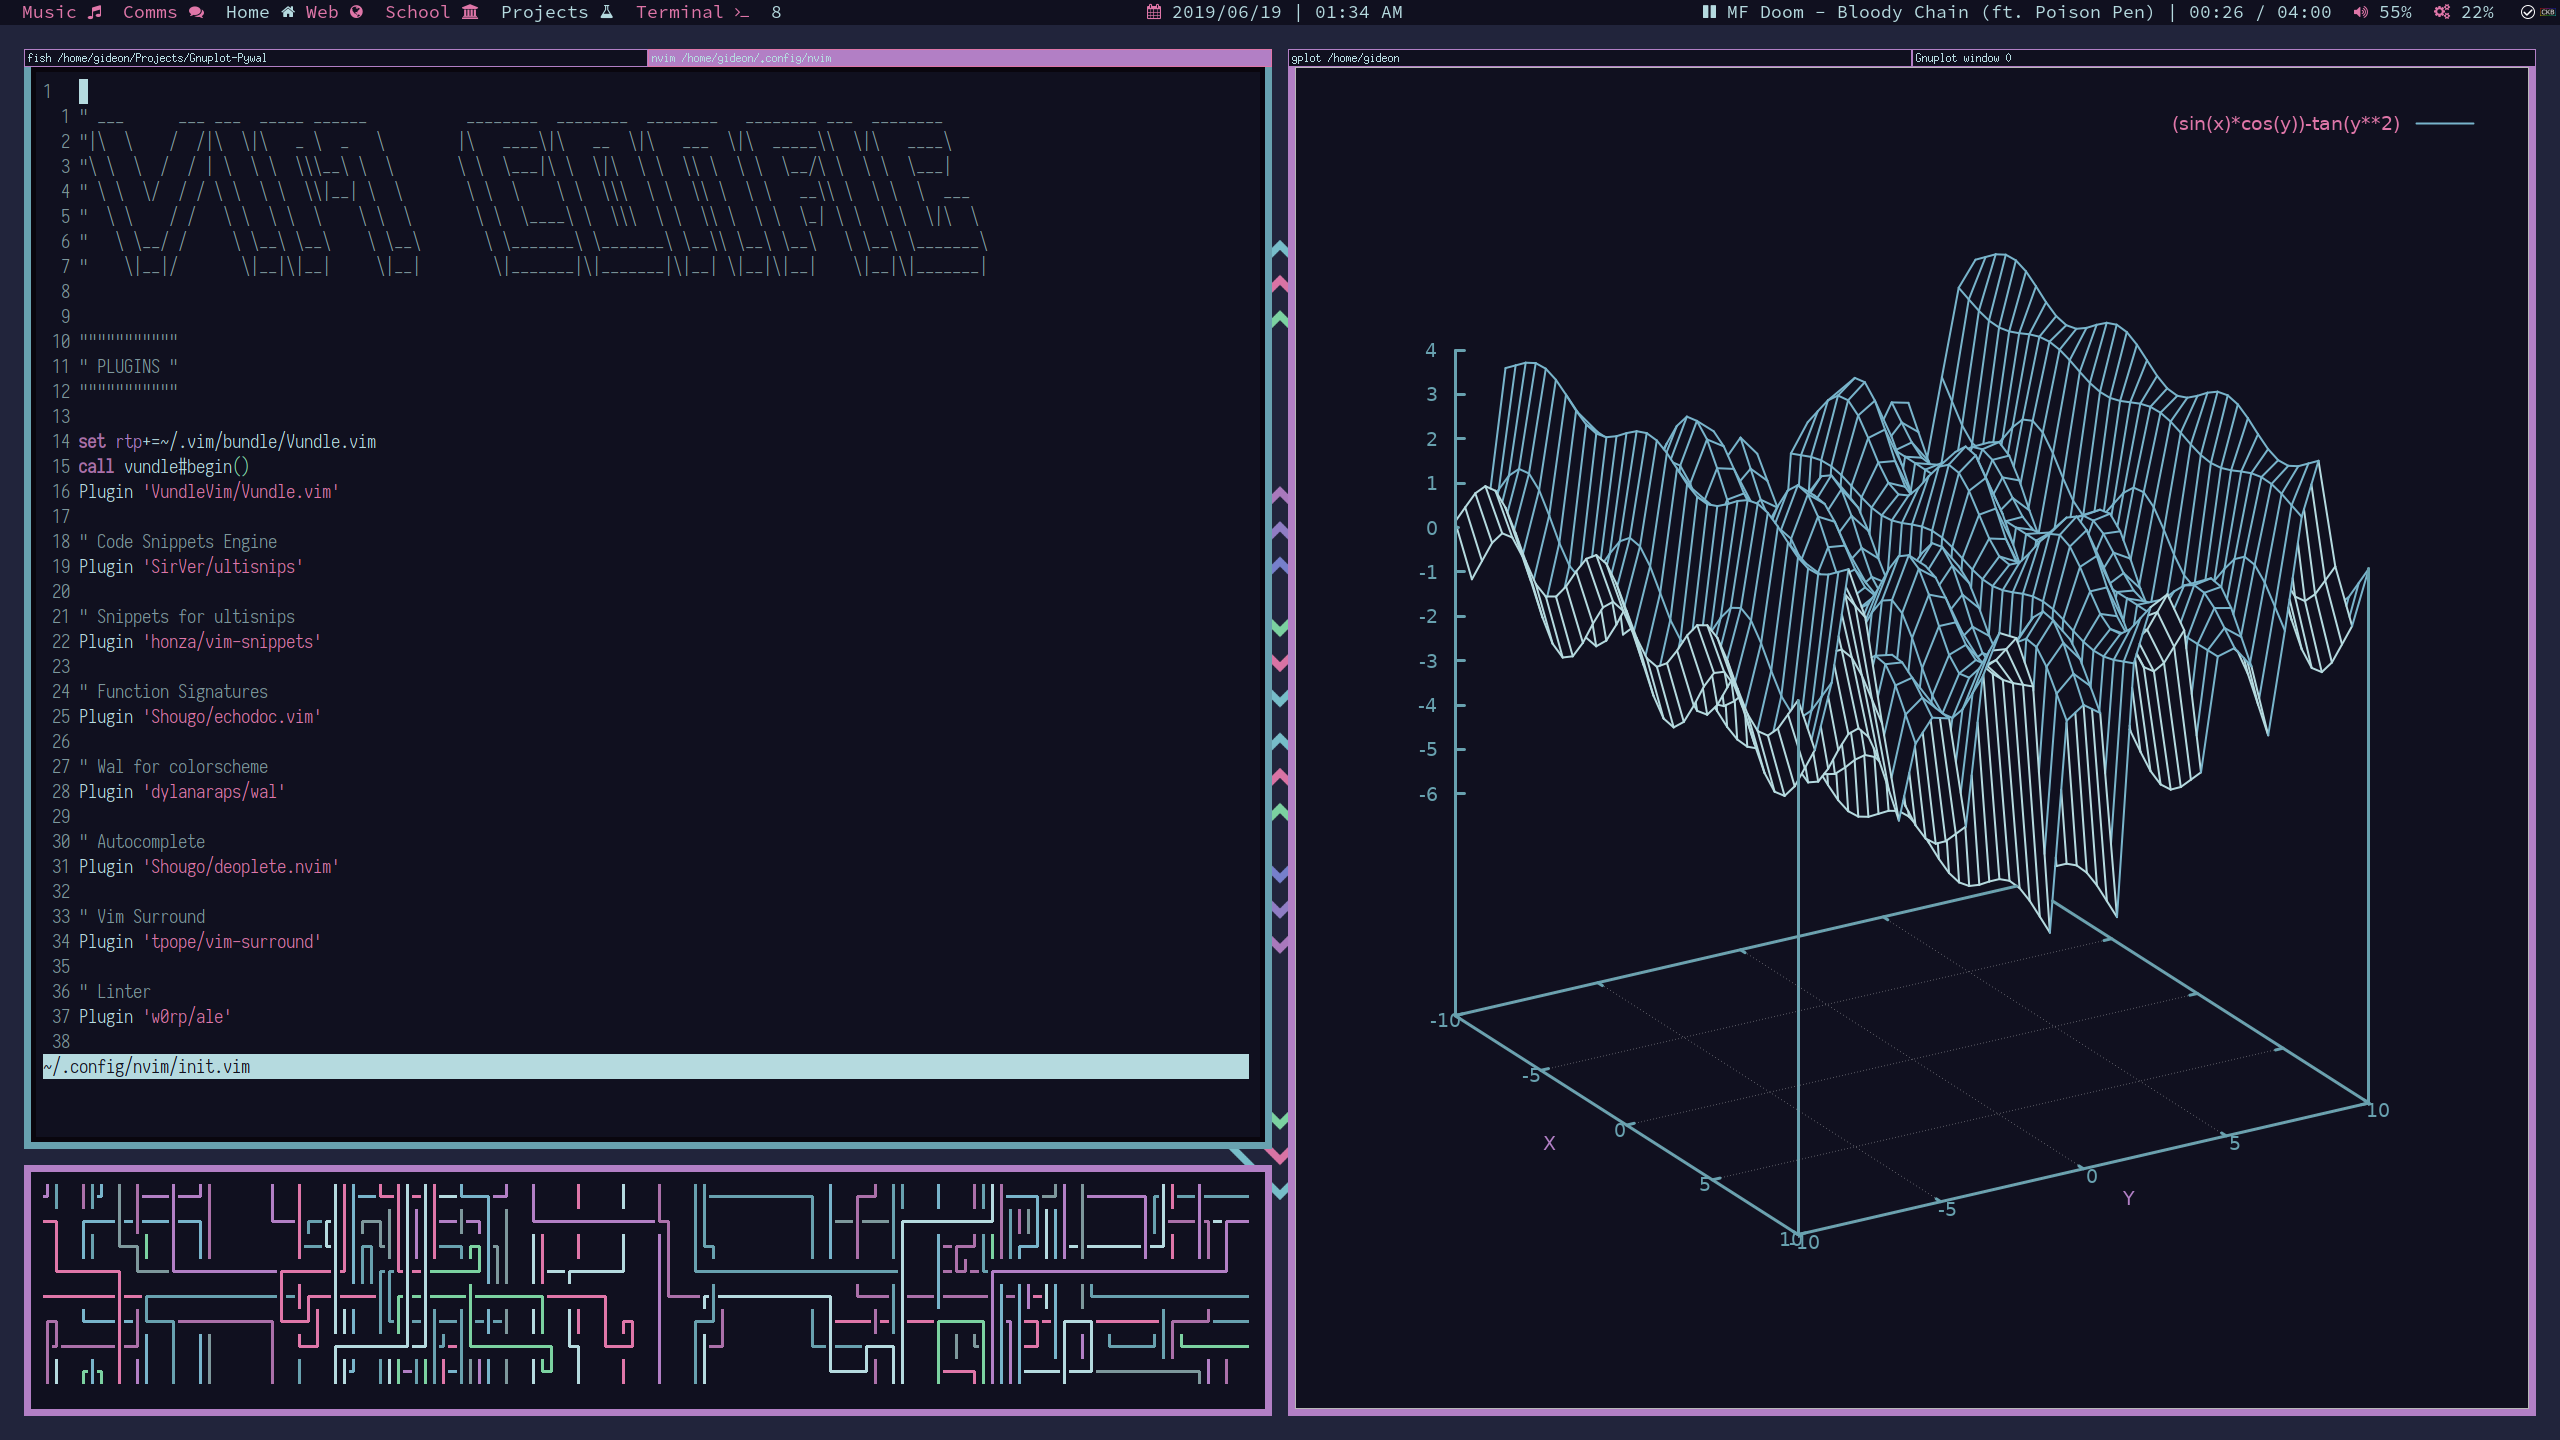 $$ (sin(x) * cos(y)) - tan(y^2)$$
Conclusion⌗
Could this have been done better? Probably 😄. But that’s what happens when you do an entire project between one and three in the morning.
Do not hesitate to contact me with any ideas for projects you would like to see!
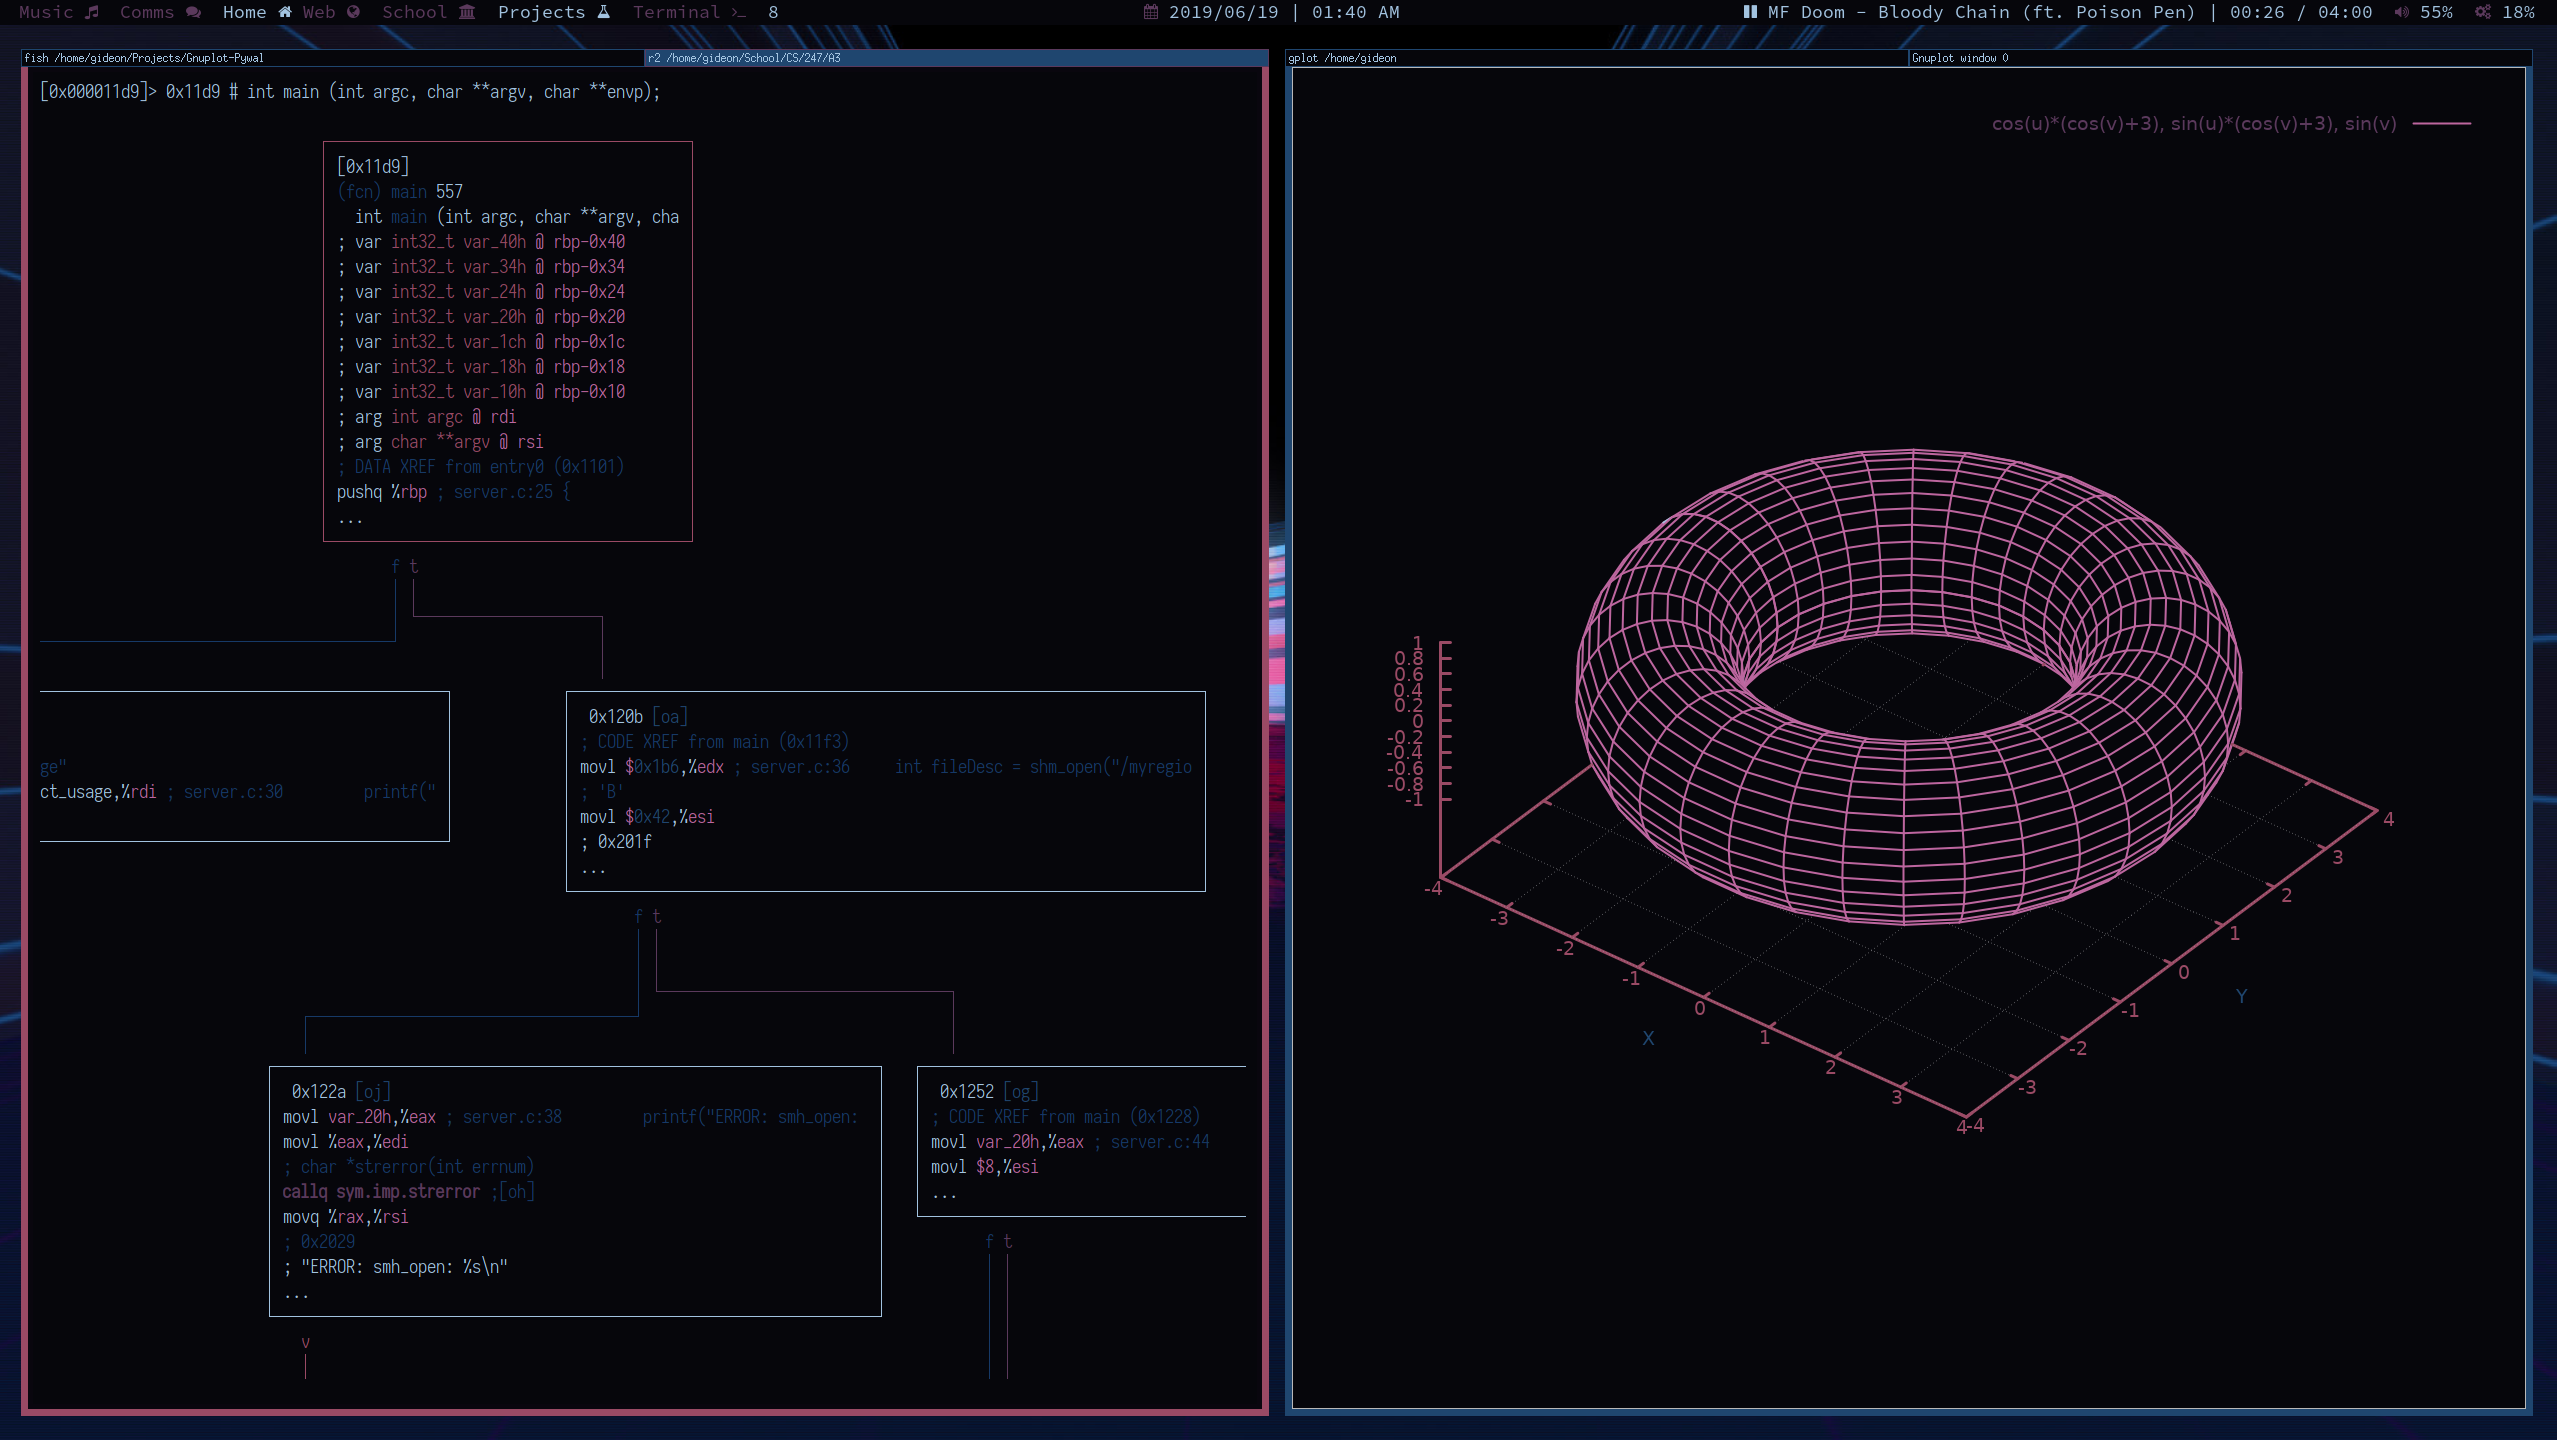
$$ cos(u) * (cos(v)+3), sin(u) * (cos(v)+3), sin(v) $$